Monday, August 31, 2020

TEXPERS Launches Redesigned Website

Members Can Now Track 

Continuing Education Credits Earned Online

The Texas Association of Public Employee Retirement Systems (TEXPERS) recently launched its redesigned website. The website, www.texpers.org, offers a user-friendly browsing experience for the association’s members, prospective members, and business partners.

“The new design offers streamlined menus, clear navigation, and a responsive layout for multiple platforms such as desktops, tablets, and mobile phones,” said Art Alfaro, TEXPER’s executive director. “The association staff are excited to have this project completed.”

Features and benefits of the newly designed site include: 

  • A more connected membership with social networking support
  • Simple tools for membership to stay in touch
  • Space for members to share resources and information
  • Ability for members to keep records of their Continuing Education credit hours online
  • Serving as primary source to collect membership dues and support event registrations

TEXPERS members who want to track their Continuing Education training credit hours will need to log into the site. Once logged in, visitors will see a "welcome" notice on the page along with the user's name. Once the visitor has accessed their member site, users can click on the "Your CE Credits" tab in the Quick Links panel on the right of the site page. 

Once logged in, TEXPERS members may also update their profile or organization information, access a directory of members, and find links to the association's bylaws. The the site provides a news feed of the association's blog as well as live updates of TEXPERS' Twitter feed. Also, members should frequent the site to stay up to date on the association's latest events.

Now Live

The newly designed TEXPERS website is now live at www.texpers.org. The site is hosted through MemberClicks, which provides software solutions to help member-based organizations such as TEXPERS with membership management, event registration, and database needs.

The Texas Association of Public Employee Retirement Systems is a statewide, voluntary nonprofit educational association organized in 1989. Operated out of Austin, Texas, its members are trustees, administrators, professional service providers, employee groups and associations engaged or interested in the management of public employee retirement systems. TEXPERS member systems and employee group members represent 2.3 million active and retired public employees with assets totaling nearly $89 billion. 

Friday, August 28, 2020

Pension Review Board Seeks Comments on 10-point Objectives Regarding Funding Policy and FSRP Requirements

Image by Gerd Altmann from Pixabay 

By ALLEN JONES/TEXPERS Communications Manager


The Texas Pension Review Board is seeking feedback regarding changes it developed concerning legislative funding policy and funding soundness restoration plan statutes.


The Pension Review Board is a state agency charged with overseeing all state and local government public retirement systems in Texas concerning their actuarial soundness. The PRB's Actuarial Committee has outlined 10 objectives regarding the statues and is looking for comments from public pension systems and other interested parties. 

>LEARN MORE: Read Our Past Coverage

In an Aug. 28 email from the PRB, the agency linked to a document of its proposed changes but pointed out that the reforms "are not fully developed."


"At this time, the PRB would appreciate comments, creative thoughts, and feedback on what is included in the document, or other ideas on how to accomplish the outlined objectives," according to the state agency's email, a copy of which is posted to the PRB's website.


The deadline to present public comments is Monday, Sept. 14. Email comments to prb@prb.texas.gov. The PRB's email states that agency staff is also available for discussion by phone. The PRB toll-free phone number is 800-213-9425.


PRB staff intends to submit comments to the Actuarial Committee during its scheduled meeting on Sept. 29, when the committee will determine which potential changes to the legislative statutes it will recommend to the agency's full Board of directors during a meeting on Nov. 12. The Board will then decide on the final legislative recommendations to present to the state Legislature.


To download the document, click here.


Below are the outlined changes presented in the document (click images to enlarge):


About the Author


Thursday, August 27, 2020

ABC 13 reporter on way to Texas/Louisiana state line witnesses hundreds of first responders headed to hurricane disaster area to help

TV news reporter sees at least 100 first responders from across Texas heading to the Texas/Louisiana state line to help after Hurricane Laura passed through the area.

Click to watch video on Facebook.

Public employees like these are often the first at disaster sites helping to save lives and property. They're keeping communities safe and running during this disaster while also dealing with a pandemic. 

They earn every penny of their promised retirement benefits. Ask your local and state government officials to protect pension benefits.

To learn more about the importance of public pensions, visit our website.


Wednesday, August 26, 2020

Don't forget: House committee accepting reports on the impacts COVID-19 had on Texas pension funds

Photo illustration/Canva.com.

By JOE GIMENEZ/Guest Writer

UPDATED Aug. 26, 2020 - There are just a couple of days left to let the Texas House of Representatives' Pension, Investment and Financial Services Committee know how the COVID-19 pandemic has impacted public pension systems.


Public pension systems have until 5 p.m. CT on Friday, Aug. 28, to provide written responses. Plan administrators who choose to file reports for their pension systems, email them to jason.briggs@house.texas.gov.


A previous email TEXPERS sent to its membership had a subject line indicating reports should be sent to the Pension Review Board. The email's subject line was incorrect. Reports should be sent to the House committee contact listed above. The information provided in the blog post linked to in the email was correct - reports should be filed with the House committee.


The Texas Legislative committee that writes law for public pension funds in the state on Aug. 4 requested regulated entities within its jurisdiction to submit written reports about the effects of COVID-19 on their operations and industry. The committee also asked whether pension funds experienced any statutory and regulatory barriers to responding to COVID-19. 

> NOTICE: Access the formal committee request.

TEXPERS is encouraging its pension system members to submit reports for this House committee inquiry. The Legislature will consider the accounts as it drafts new laws in 2021. TEXPERS doesn’t know what those laws and responses will be, but the association does know that other quasi-governmental agencies will be submitting reports. In government, the squeaky wheel gets the grease, and it’s important for the Legislature to have a complete picture of the adjustments that our pension system members have made in 2020. 


Plan administrators who choose to file reports for their pension systems, please email them to jason.briggs@house.texas.gov. Again, the due date is 5 p.m. Friday, Aug. 28. TEXPERS would appreciate a courtesy copy as well. 


TEXPERS recommends that its member systems also create and file their reports or submit fund experiences to TEXPERS for the association to include in a report it plans to file. Those plans wishing to add their system reports in the association’s response should email them to media@texpers.org no later than Wednesday, Aug. 26.


The reports do not need to be extremely lengthy. TEXPERS offers the following chart as a guide to developing system responses. It is not exhaustive, so administrators who feel there are other ways that COVID-19 impacted their system or members should not hesitate to include them in their reports. Also, these subjects are just suggestions, and system administrators are under no obligation to respond to anyone of them. 


Questions

Responses

Basic information

  • Name of your system
  • Number of active and retired members
  • Assets under management
  • Any other system information, like amortization period, funded ratio, etc


Board and Committee Meetings

  • How has your Board conducted meetings since March? In-person or via teleconference or video conference?
  • Has there been any challenges/costs with video teleconference meetings?
  • How have committee meetings been conducted?
  • Governor Abbott continues to allow video/conference meetings through relaxation of the Texas Open Meetings Act. Should he continue doing this?
  • Are there any metrics about virtual meetings that you can include? Number of meetings. Number of Board meetings present/absent/quorum.
  • Where there any additional costs incurred to conduct Board and committee meetings?


Compliance with State Regulations


State laws Senate Bill 2224 and House Bill  322 went into effect in 2020. The Funding policy for SB 2224 was due Jan. 1 and the independent assessment for HB 322 was due on May 1.

  • How did COVID-19 affect your ability to comply with these new laws? Did you seek waivers for deadlines from the Pension Review Board?
  • If your system was subject to Intensive Reviews or Funding Soundness Restoration Plans by the Pension Review Board, did COVID-19 impact your compliance with deadlines or production of reports?


Member Services

Many pension systems closed their offices to member visits and asked members to work with benefits staff by telephone, email or video conference meetings. Please address these questions for active and retired members:

  • How did your system handle member meetings?
  • How did your members respond to virtual meetings regarding their benefits?
  • Where there additional costs to the pension fund for facilitating member services during this time?


Office Operations

  • Did you shut your office? Reopen?
  • Did your staff operate remotely?
  • Were there any disruptions to any office operations?


Technology

  • How did existing information technology infrastructure help your pension system operate?
  • Did you have to purchase any additional IT software or hardware to continue or enhance operations?


Investments

  • Was your pension system able to work with your managers and investment consultants as needed, especially during the market downturn?
  • How have your investments weathered the storm?
  • How does your board believe COVID-19 will affect the economy and how is it positioning investments accordingly?


After the House committee's submission deadline, received written responses are to be shared with each member of the committee. The committee also will make available to the public a copy of all submitted comments.

Part of the House Committee on Pensions, Investments, and Financial Services’ commission is to preside over matters about benefits or participation in benefits on a public retirement system and the financial obligations of a public retirement system. The 11-member committee is chaired by Rep. Jim Murphy, R-Houston


About the Author: 

Tuesday, August 25, 2020

Dollar Weakness Helps Gold To All-Time Highs

Image by Linda Hamilton from Pixabay

By JOE FOSTER/VanEck

Market Review

The gold bull market passed two important sign-posts in July. The strength of the market is impressive as it blew through $1,800 and the all-time high of $1,921. These prices had been major technical resistance points set a decade ago.

The second significant signpost in July was the new U.S. dollar weakness. U.S. dollar weakness is a hallmark of most gold bull markets, but in this cycle gold had so far been rising in a flat dollar environment. The chart below shows the U.S. dollar index (DXY) has been in a bull market since 2011. However, the dollar declined through July, then fell precipitously at the end of the month, appearing to have broken its long-term trend. We may be seeing the beginnings of a bear market for the dollar. This enabled gold to test the $2,000 per ounce milestone as it reached an intraday high of $1,983 on July 31. Gold closed out July at $1,975.86 per ounce for a $194.90 (10.9%) monthly gain.

U.S. Dollar Index Breaking Its Near 10-Year Support Trend? (2011 - 2020)

Click chart to enlarge.

Gold stocks moved higher as the vast majority of companies reporting second quarter results met or exceeded expectations. COVID-related costs were also reported, showing the industry has done an excellent job of dealing with operational issues in our view. For example, 1.7 million ounce producer Agnico-Eagle was among those hardest hit by pandemic lock downs. Its costs for temporary mine suspensions totaled $22 million, whereas the cash provided from operations totaled $162 million. Going forward, per the company’s second quarter 2020 financial results, Agnico-Eagle expects COVID protocols to cost $6 per ounce, which raises their cash costs by less than 1%.

Junior developers are a class of company that you won’t find much of in passive index funds like GDX or GDXJ. These are companies with properties that are in various stages of development, but not yet producing gold. Our active gold equity strategy invests across the spectrum of companies and currently carries 22 junior developers that total approximately 26% of the strategy’s net assets as of end-July. These companies had been underperforming since the gold price broke out in June 2019. This is a sharp contrast from past bull markets, when the juniors began outperforming the larger companies much earlier. Through the second quarter and into July, the junior developers have finally kicked into gear. Seven of our juniors have now gained over 100% year to date. We don’t expect to give back these gains because the stocks had been extremely undervalued and many of our companies have announced encouraging drill results and new discoveries that create lasting value. In addition, investors have returned to the junior sector, enabling companies to raise $1.5 billion this year, and the second quarter was their strongest for equity raises since 2012, according to RBC Capital Markets.

Outlook

Gold has tested the $2,000 per ounce level sooner than we had anticipated and we believe there is more than the pandemic to overcome at this point.

  • Slower Recovery – During July, two Federal Reserve (Fed) presidents, a Fed governor, and its Chairman all warned of a long, slow road to economic recovery. Initial jobless claims have stagnated for eight weeks at around 1.4 to 1.5 million. Contrast this with the Global Financial Crisis (GFC), where initial jobless claims declined steadily to 587,000 in the same time frame, seventeen weeks after the recession peak. JPMorgan said it was preparing for an unemployment rate that remains in double digits well into next year and a slower recovery in gross domestic product (GDP) than the bank’s economists assumed three months ago.
  • Deficits, Debt & Defaults – The U.S. budget deficit totaled $863 billion in June, as much as the entire gap in 2019. With the new stimulus bill now being considered in Congress, the annual deficit could exceed $4.7 trillion. This is on top of record peace-time deficits before the pandemic. Corporate debt is also at record levels and many households are feeling financial stress. Ultra low interest rates over the past two decades have encouraged the accumulation of unproductive government and private debt. It fuels the rise of giant firms, while “zombie” companies (companies with earnings less than their debt service costs) have proliferated. This is at the expense of start-ups, innovation and creative destruction. The result is low levels of productivity, causing recoveries to become weaker and weaker. The Wall Street Journal reports the largest U.S. banks have set aside $28 billion to cover losses as consumers and businesses start to default on their loans.

The pandemic created a deflationary shock to the economy and the massive accumulation of debt since the GFC creates a drag on productivity that could guarantee a low growth economy for decades to come. Negative real rates, persistent risks to economic well-being, and the weak dollar are drivers that we believe could enable gold to trend to $3,400 per ounce in the coming years. This might be a conservative forecast considering the 180% rise gold experienced from the depths of the GFC. Several scenarios could see gold prices moving higher from there:

  • Systemic collapse as debt issuance overwhelms the financial markets.
  • An inflationary cycle brought on by either: a) trillions of U.S. dollars, euros, yen and yuan being pumped into the global financial system, b) governments enabling inflation to ease the debt burden, c) implementation of modern monetary theory or other forms of money printing to fund government spending without issuing debt.
  • U.S. Dollar Crisis – America is dealing with deficits, divisive politics, social unrest and deteriorating international relations on a scale rarely seen in history. While other countries may have similar problems, they do not oversee the world’s reserve currency. The U.S. is held to a higher standard and a crisis of confidence could weigh heavily on the dollar.

Some might balk at such bold forecasts, however, we believe the various drivers of gold are rarely aligned as they are today. We also consider gold’s relative size in the financial markets. There have been 200,000 tonnes of gold mined in the history of the world and virtually all of it is potentially available to the market. A gold price of $2,000 per ounce yields a market value of $12.9 trillion. Compare this with global stock, bond and currency markets, each of which totals roughly $100 trillion or more. A relatively small shift in funds from these markets may fuel the gold price for a long time.

In addition, the market value of the global gold industry as of end-July is approximately $530 billion. The market value of Alphabet Inc. as of the same time, alone, is $1.0 trillion. Gold mining is a relatively tiny sector that, in addition to carrying earnings leverage to the gold price, carries a scarcity factor when market demand is high.

VanEck Securities Corp. is an Associate Member of TEXPERS. The views expressed in this article are those of the authors and not necessarily VanEck nor TEXPERS.

About the Author

Joseph Foster joined VanEck in 1996 as a precious metals mining analyst, and has been Portfolio Manager for the VanEck Gold Strategy since 1998. He also serves as Strategist for the VanEck Global Hard Assets Strategy. He covers gold mining equities ranging from small-cap exploration to senior producers. He also forecasts and monitors gold-related market conditions and models the asset bases of mining companies.

Foster is one of the most experienced investment managers in the field of gold and gold stocks portfolio management, with over 35 years of experience in the industry as a geologist and investment manager. He has over 14 years of dedicated experience in geology and mining. From 1992 to 1996, he was a Senior Geologist at Pinson Mining Company, where he managed an on-site geology department and conceived and implemented a comprehensive exploration program on a 35 square-mile land position. His primary responsibility was to find new gold reserves that could extend the life of the mine. In addition, Mr. Foster established an AutoCAD-based geologic information system that incorporated geological, geo-chemical, geophysical, topographic, and drilling data compiled over a 20-year period. From 1988 to 1992, as a Mine Exploration Geologist, Foster planned and supervised up to 30,000 feet of exploration drilling per year. Prior to 1988, he was an Exploration Geologist with Lacana Gold Inc. in Reno, Nevada. Foster started his career in 1981 as a summer intern as a geologist for Atlas Mining, an underground uranium mine in Green River, Utah.

Foster received a master's degree in Geology from the Mackey School of Mines and an MBA from the University of Nevada-Reno. He graduated Magna Cum Laude with a bachelor's degree in Geology from Tennessee Technological University. Foster has appeared in The Wall Street Journal, Financial Times, Barron’s, The Wall Street Reporter, Reuters TV, CNBC, Fox News and Bloomberg TV. He has published articles in mining journals, including Mining Engineering, Society of Economic Geology, and Geological Society of Nevada.

It is not too late to de-FAANG your portfolio

Image by Free-Photos from Pixabay

By TATJANA PUHAN/TOBAM

If the only alternative to forecasting ability is accessing the risk premium in its purest form, some investors in their search for the beta believe that passive management, defined as the investment vehicles tracking market-capitalization weighted indices, offers access to this beta. There is a myth or misunderstanding that “passive = neutral”.

The shortcomings of replicating market-cap weighted benchmarks

Passive investing, which is often described as beta investing, does not provide neutral access to the risk premium. Investing in a cap-weighted benchmark means buying a portfolio that can be hugely biased to sectors, styles, countries and individual securities. There is ample academic literature to support this.

These benchmarks take on heavy structural biases that evolve over time. They are inherently biased as they attribute greater index representation to stocks or factors as they have appreciated and less after they became cheaper. They represent the sum of all speculations of all market participants and these implicit bets change dynamically over time as the benchmark re-weights assets. Because they attribute greater representation to stocks whose share prices have risen, market capitalization-weighted benchmarks maximize their exposure to the past winners.

As a consequence, they do not offer pure beta or immunity from financial speculation.

Furthermore, because an investor tracking these indices would therefore have to allocate more money to the largest risk drivers, these benchmarks inherently forecast that the successes of the past will be successes of the future.

Chart 1: US Equity Market - Sector Weights

Source: TOBAM calculations - Figures as of June 30, 2020. Key Risks: The value of your investment and the income from it will vary and your initial investment amount is not guaranteed. Allocations are subject to change. Of note, GICS introduced a new sector classification in September 2018, that impacted US sector weights. Please contact us for TOBAM’s view on the reclassification and access to our dedicated dashboard on the topic. Click chart to enlarge. 

As concerns about the impact of numerous macro risks, including ‘trade wars’, slowing economic growth and many other factors affecting the macro environment continue, investors may turn to diversification in an attempt to more broadly spread out their risk exposure.

For investors seeking diversification both within and among broad investment universes using market cap weighted indices such as MSCI US or MSCI Emerging Markets, they may be surprised to learn that these indices today reflect historically high levels of risk concentrations in a few stocks with large weights and whose price movements have increasingly been moving in similar directions.

When it comes to diversification, investors may tend to consider spreading investments out across many securities, sectors, regions, and asset classes. That’s only part of the story; a portfolio is well-diversified if its holdings avoid sharing common, correlated risk.

Examining the current level of diversification in Equity markets

As some investors consider weights as an appropriate measure of exposure, we will examine first the collective weights of the top 5 stocks in US and Emerging Markets equities as of end July:

Chart 2: MSCI USA Universe
Weight Concentration: Top 5 Stocks = Bottom 431

Click chart to enlarge.

Not only is the weight concentration of these leaders in Developed and Emerging Markets indices very high as a proportion of the investable universe, but ….

Chart 3: MSCI EM Universe
Top Weight Concentration: Top 5 Stocks = Bottom 1112

Click chart to enlarge.

Chart 4: Relationships Between the Top 5 Stocks in Both S&P 500 and MSCI EM:

Click chart to enlarge.

…. these charts also show that investing in US or Emerging Equities via passive ETFs is providing very similar exposure as investing in the FAAMG companies and their partners, competitors, providers, all surfing on the same wave.

TOBAM introduced and patented the Diversification Ratio which aims to measure to what extent a portfolio is diversified. Using this measure, we can demonstrate that the overall level of diversification available in these universes is currently at historical lows last observed in 2002. This ratio has been steadily declining in the MSCI US index since December 2014 and since September 2016 in the MSCI EM index, exposing passive investors to a limited number of independent risk factors and thus depriving them of broad, diversified exposures.

Chart 5: MSCI US Universe DR²

Click chart to enlarge.

Chart 6: MSCI EM Universe DR²

Click chart to enlarge.

The currently historically low levels of the Diversification Ratios for MSCI US and MSCI EM indices suggests that investors using ETFs tracking these indices are leaving a lot of diversification on the table. Even worse so, the tech outperformance during the recent market turmoil made US markets even more concentrated.

At the same time, the first clouds arrive on the skies of the big tech companies in EM markets. The underperformance of the EM tech mega caps in the rebound contributed to a slight de-concentration. Is this the beginning of a longer-term trend?

How to invest during a historically high market concentration, along with high economic and political uncertainty?

Given the recent rise in turbulence in equity and bond markets, investors may feel their crystal ball is cloudier than in the past, in fact, in fact, how realistic is the expectation of having a clear and concrete picture of the true economic impact of the coronavirus crisis? After all, the future evolution of the virus spread is, itself, completely unclear. On that basis, how can investors know what even central banks and governments do not?

So, what comes next? As a second phase of the market slump, will signs of a massive consumer crisis become non negligible and be priced into sectors or stocks that have seemed almost invulnerable so far such as the FAAMG? Will a second (or, indeed, third) wave of virus infections send us all back into a lockdown with almost unquantifiable further economic consequences? And for how long can central banks and governments credibly continue to play the white knight?
All what that we know at this point is that we know nothing for certain. The best answer to such uncertainty and a future that we cannot forecast is, most likely, the principle of diversification.

Looking back, a well-diversified portfolio would have prevented investors from being overly exposed to the oil price shock and the massive sector sell-off, while allowing the average investor to take advantage of the true market risk premium in an environment of highly dispersed asset prices. While the art of constructing of a truly diversified portfolio would be worthwhile an article by itself, there is no uncertainty that these basic laws of portfolio construction will continue to be applicable and deliver the true market premium to investors.

TOBAM Core Investments is an Associate Member of TEXPERS. The views expressed in this article are those of the authors and not necessarily TOBAM nor TEXPERS.

About the Author

Tatjana Puhan, is Managing Director, Deputy Chief Investment Officer at TOBAM. She is responsible for the management of all research and product creation related projects, Co-Management of the Research and Portfolio Management as well as Trading teams based in Paris and Dublin assuring the coherence and application of the investment process. Previous to joining TOBAM, Puhan was appointed as Head of Equity and Asset Allocation for Third Party Asset Management at Swiss Life Asset Managers. In this role, she was responsible for a number of the company’s flagship strategies, most notably its investment solutions utilising systematic and proprietary quantitative approaches, as well as contributing to Swiss Life Asset Managers’ asset allocation and equity research initiatives. Puhan has more than 15 years’ investment experience, worked at a number of leading asset management and private banking businesses while also bringing a strong academic and research background.

Puhan holds a Master’s degree in Finance and Business Administration from the University of Hamburg, and gained her Ph.D. in Finance from the Swiss Financial Institute at the University of Zurich, with research fellow appointments at the University of Zurich, Kellogg Business School (Northwestern University) and the University of Hamburg. She is a lecturer in finance at the University of Mannheim and an associated researcher of the Hamburg Financial Research Center.

The Case for a Permanent Allocation to an Equity Stabilization Strategy

Image by Samuel F. Johanns from Pixabay

By CRAIG STAPLETON & JEREMY GOGOS/Securian Asset Management

Key Points

  • Institutional investors face a balancing act between two equally important needs: achieving robust long-term returns while avoiding the painful consequences of near-term drawdowns.
  • Traditional asset allocation, risk parity and other hedging strategies have failed to perform as expected during recent downturns. Fixed income assets have moved closely in line with equities in times of crisis.
  • Equity volatility levels exhibit a persistent and reliable relationship with equity returns over time and through market cycles, including the latest market crisis, as illustrated for large cap U.S. equities in Chart 1.
  • A permanent strategic allocation to an equity stabilization strategy that utilizes the persistent volatility/return relationship can improve investors’ long-term risk/return ratios – even if implemented right after a market selloff. A rules-based approach, using the reliable indicator of recent volatility, can be successfully applied at any time via a spectrum of implementations against single or multiple risk asset class portfolios.

Chart 1: There is a Clear Relationship Between Monthly Equity Returns and Recent Volatility

Average Monthly S&P 500 Returns for Ranges of Realized Monthly Volatility
(January 1, 1928 – March 31, 2020)

Click chart to enlarge. Source: Bloomberg. Data as of April 1, 2020. The data spans from January 1, 1928, to March 31, 2020, and the table displays the average monthly returns for the S&P 500® for the time periods shown where the average monthly volatility was in the different volatility categories shown. Volatility is measured as the annualized standard deviation of daily returns of the index. The S&P 500® Index is an unmanaged index of 500 stocks that is generally representative of the performance of larger companies in the U.S and investments cannot be made directly in the indices. See additional disclosures at the end of the materials for additional information.


Risk Assets: Investors Manage a Double-Edged Sword

Institutional investors face the pernicious dilemma of having mutually conflicting needs. When building a portfolio, investors start with the understanding that, over the long term, expected return and volatility are strongly positively correlated. Unfortunately, most investors need both significant levels of return to meet their long-term goals and a stable stream of returns to ensure financial viability. A defined benefit pension plan, for example, needs solid returns to meet its actuarial funding goals and pay pensions, while it needs stability to avoid erosion of its funded status.

For institutional investors seeking stable funding, the same risk assets that provide essential upside potential also represent significant exposure to downside risk and unstable results. Although investors’ need for risk mitigation is high, most investors have not implemented such strategies to date, for reasons we discuss below.

The Risks of Managing Risk: Why Most Portfolios Remain Exposed

For a risk mitigation strategy to be reliable, it must be built on a market relationship that is persistent over time. Unfortunately, most risk mitigation strategies to-date have been based on historic correlations that have broken down during strong bear markets, when they are most needed.

Fixed Income is an Anchor to Windward Until a Hurricane Comes

A common approach to mitigating equity volatility risk is the classic asset allocation strategy combining equity and fixed income assets, for example in the traditional 60/40 portfolio. The logic is that the two asset classes are negatively correlated most of the time, so fixed income serves as a portfolio’s ‘anchor to windward’ when volatile equities experience periodic selloffs.

Unfortunately, the correlation between fixed income and equity investments is not stable through time. As Chart 2 illustrates, there have been long periods where equities and bonds were positively correlated, and thus traditional portfolio diversification did not reduce portfolio risk.

Chart 2: Fixed Income is Not a Reliable Equity Hedge

3-Month Rolling Correlation – S&P 500 and Bloomberg Barclays U.S. Aggregate Bond Index
(January 1, 1989 - March 31, 2020)

Source: Bloomberg Barclays US Aggregate Bond Index and Securian Asset Management, Inc. Data as of April 1, 2020. The data spans from January 1, 1989, to March 31, 2020, and displays analysis of two indices, the 3-month rolling correlation of the S&P 500 vs. the Bloomberg Barclays U.S. Aggregate Bond Index. The blue circles highlight the specific periods of time. Click chart to enlarge.

In crises — when an offset to downside equity risk is most needed — equities and fixed income often sell off at the same time. During the COVID-19 crisis, the correlation between fixed income assets and equities quickly became much less negative, diluting fixed income’s portfolio diversification benefit. Further, there have been extended periods of time where fixed income was positively correlated with equity. Both are highlighted in the circles in Chart 2.

Volatility is a Reliable Indicator of Equity Performance

A persistent and reliable relationship exists between 1-month volatility and 1‑month equity returns, both positive and negative. Volatility episodes tend to demonstrate persistence. As Chart 3 clearly shows, since 1928, for the S&P 500, high 1-month volatility tends to be associated with poor 1-month returns; and vice versa.

Chart 3: Since 1928, Volatility Levels Have Reliably Signaled Equity Returns

Average Monthly S&P 500 Return vs. Average Monthly Realized Volatility

(January 1, 1928 - March 31, 2020)
Source: Bloomberg, Securian Asset Management, Inc. Data as of April 1, 2020. Data spans from January 1, 1928, to March 31, 2020, and displays the average monthly S&P 500 return vs. the average monthly realized volatility. Click chart to enlarge.

While we use the S&P 500 for the illustration above, our research shows the same relationship between volatility and returns across other equity markets. 

Volatility-Based Equity Stabilization Strategy Can Improve the Risk/Return Ratio

A strategy based on the reliably strong relationship between equity volatility and returns is well-suited to deliver portfolio risk mitigation in a more consistent manner than traditional asset allocation. An Equity Stabilization Strategy systematically adjusts equity exposures based on the volatility/return relationship. This approach holds greater equity market exposure during lower volatility periods, which tends to lead to better performance, as illustrated in Chart 3. Conversely, we believe this approach can quickly reduce equity market exposure during the higher volatility periods that tend to produce unfavorable performance, mitigating the drawdown of assets.

The Case for a Permanent Strategic Portfolio Allocation to Volatility-Based Equity  Stabilization Strategies 

To-date, institutional investors have implemented volatility-based stabilization strategies sporadically or not at all. We believe this reticence is due to two key investor concerns: Portfolio risk hedging is complex, and a desire to avoid periodic carrying costs of hedging – particularly right after a major market selloff.

A permanent strategic allocation to a systematic volatility-based approach over a full market cycle addresses both of these issues.

The Straightforward Principle of Volatility-Based Stabilization Strategies 

A simple set of rules using 1-month risk asset volatility as the principal metric is the foundation of an equity stabilization strategy. A strategic overlay primarily employing listed equity index futures ensures transparency and simplicity while avoiding counterparty risk.

Implementing Volatility-Based Risk Mitigation is Straightforward

The Stabilized Equity Portfolio Hypothetical Example, is based on a pension plan aiming to reduce its domestic U.S. equity annualized volatility by about 25% from its historic average level of around 18% per annum. In this hypothetical, the pension fund added a futures-based overlay on top of its equity portfolio, using listed S&P 500 futures to dial the effective equity exposure up or down based on volatility. Using this overlay, the portfolio manager allows the portfolio’s effective equity position to drop down to 20% of the portfolio’s net assets in high volatility environments and increase it to as much as 150% in low volatility environments.

Chart 4: Equity Stabilization Strategy Improves Risk/Return

Stabilized Equity Portfolio Hypothetical Risk & Return

(January 1, 1988 - March 31, 2020)
Source: Bloomberg, Securian Asset Management, Inc. The data spans from January 1, 1988, to March 31, 2020, and displays the hypothetical backtested returns of a hypothetical portfolio created for illustrative purposes only. No investor actually achieved the results shown. No representation is being made that any account will or is likely to achieve results similar to those shown. Please see important disclosures on the limitations of hypothetical backtested performance at the end of the materials. Click chart to enlarge.

Skillful Implementation Adds Further Value to a Stabilization Strategy

The pension fund’s overlay manager should take the following steps:

  • Run the overlay model daily
  • Combine experience-based judgement and additional subsidiary indicators such as the VIX and high-yield spreads to better assess the likely volatility environment daily
  • Primarily use listed futures, and use listed options when inexpensive or more attractive
  • Employ strict trading rules to protect the pension fund from being whipsawed in rapidly changing market environments
  • Employ strong derivatives governance and oversight

Balanced Portfolios Benefit as Well

Using a volatility-based risk mitigation strategy on the equity portion of a balanced portfolio is an effective way to adjust the equity/bond mix to changing risk environments, without the costs and timing issues of selling the underlying assets.

Positive Full Market Cycle Cost/Benefit

When a volatility-based portfolio risk management approach is maintained throughout a full market cycle, its outperformance in down markets can offset its underperformance in up markets, rendering a market-like return over a full cycle.

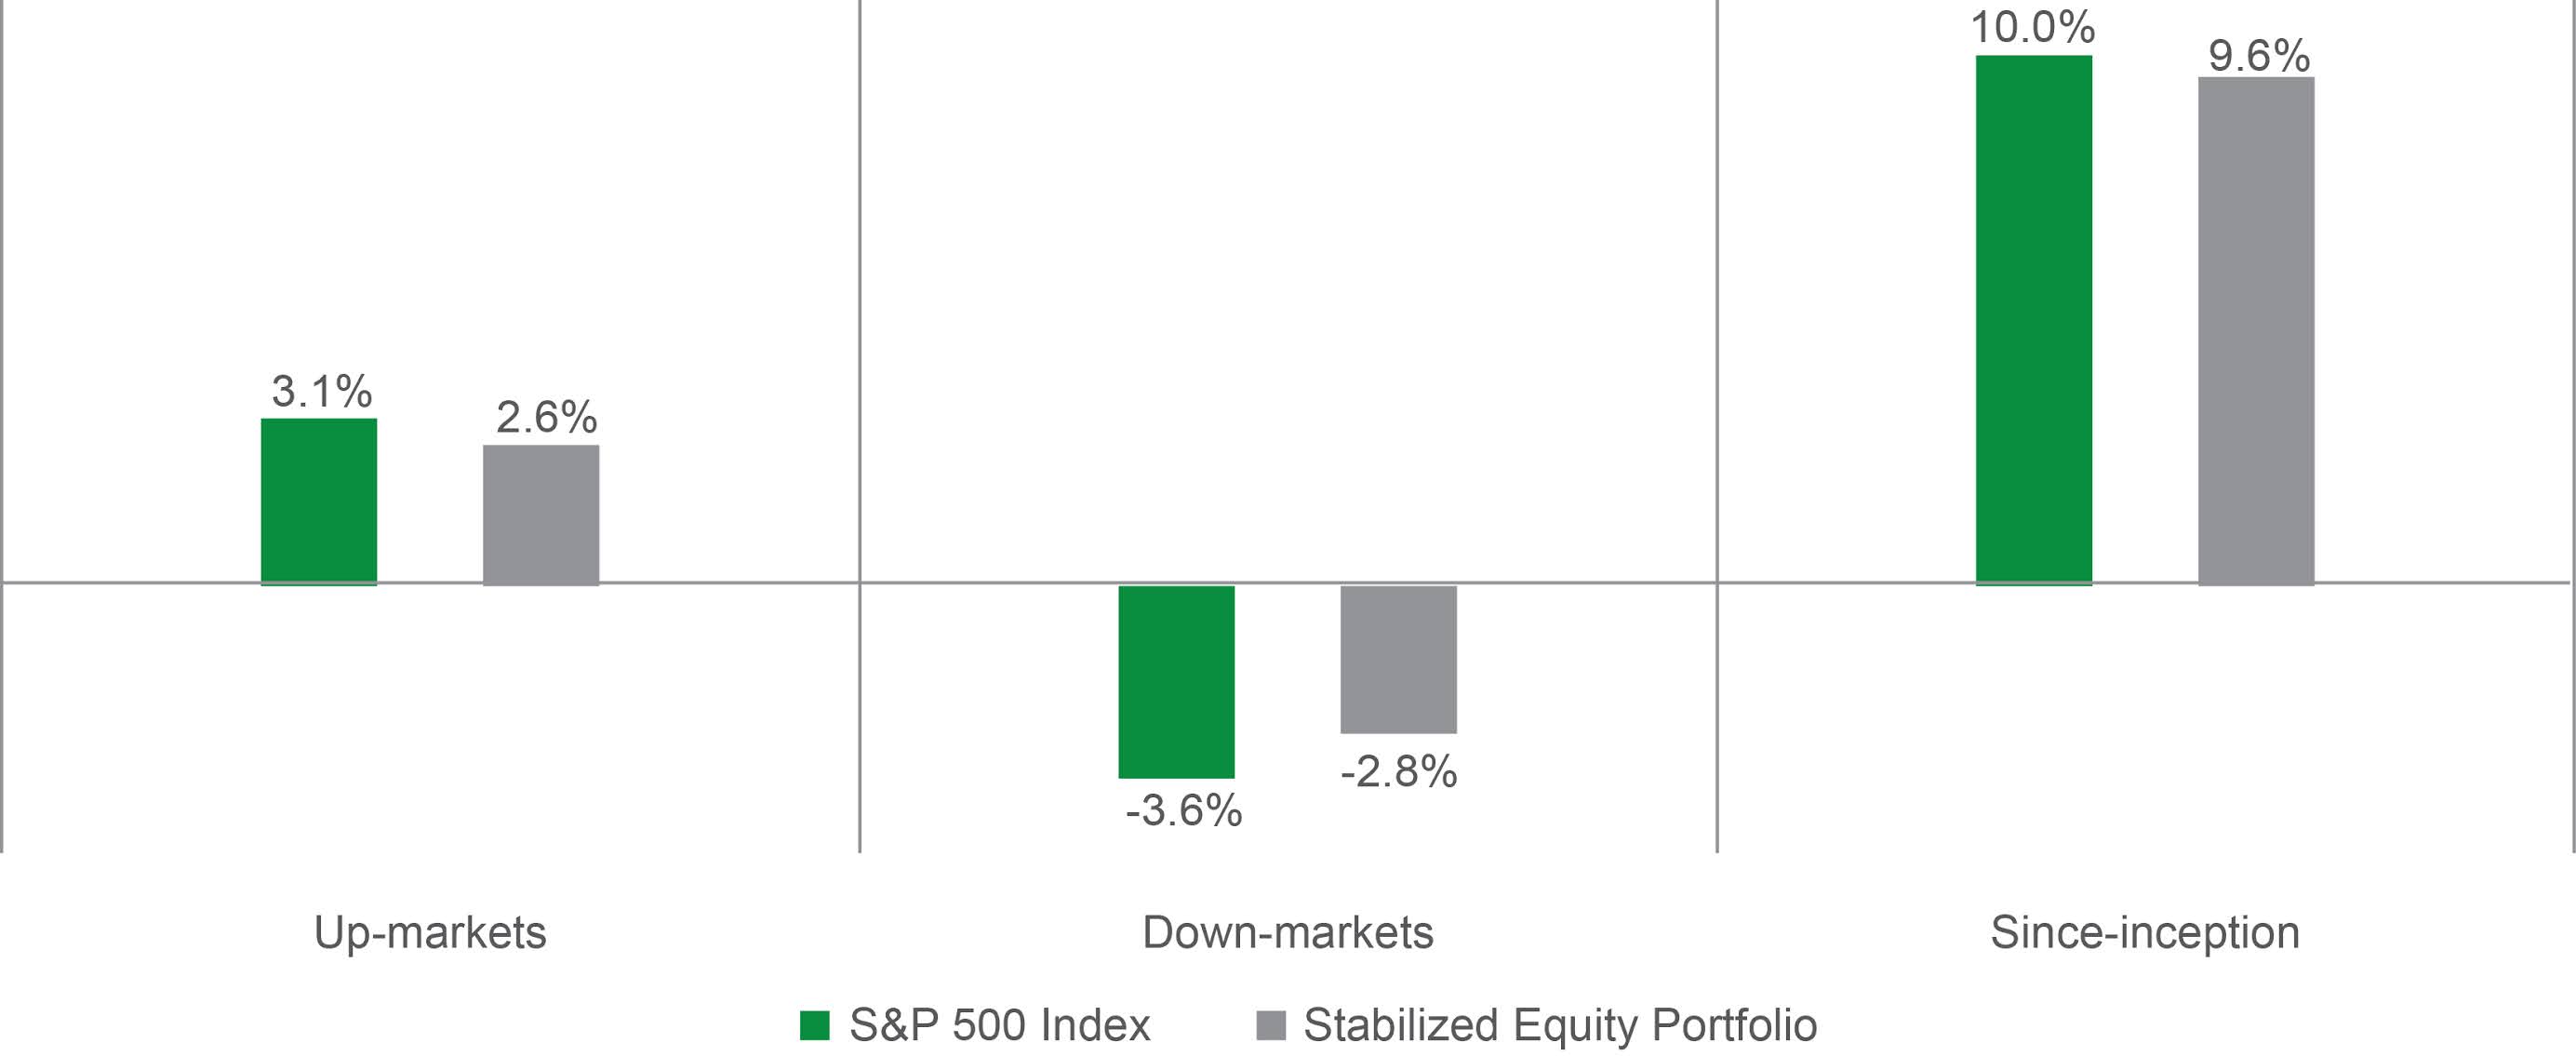
Chart 5: Thoughtful Equity Stabilization Can Pay for Itself Over a Full Market Cycle

Average Monthly Returns of the S&P 500 Index and the Stabilized Equity Portfolio Hypothetical Example in Up Markets, Down Markets, and Longer-term

(January 1, 1988 - March 31, 2020)
Source: Bloomberg, Securian Asset Management, Inc. The data spans from January 1, 1988, to March 31, 2020, and displays the hypothetical backtested returns of a hypothetical portfolio created for illustrative purposes only. No investor actually achieved the results shown. No representation is being made that any account will or is likely to achieve results similar to those shown. Please see important disclosures on the limitations of hypothetical backtested performance at the end of the materials. Click chart to enlarge.

Implementing a volatility-based risk mitigation approach by means of a derivative overlay means there is no disposition of underlying assets, merely a modification of risk exposures, thus avoiding trading costs and buy/sell spread costs. While there may be periodic ‘carrying costs’ of foregone performance in a bull market, the strategy tends to pay for itself over a full market cycle – avoiding the extensive long-term portfolio damage that a liquidity crisis during a bear market can wreak – as shown in Chart 5, above.

Portfolio Hedging is Vital after a Market Selloff

Perhaps counterintuitively, a volatility-based stabilization strategy is vital after a severe market shock, such as the recent COVID-19 pandemic shock.

After an historic downturn in the markets, most institutional portfolios are significantly underweight equities. In order to benefit fully when the markets inevitably recover – and in order to rebalance to their strategic asset mix targets – institutions need to re-risk by adding to their equity exposures.

This may be a difficult decision for many institutions, because the market bottom is only known to have occurred well after the fact. A reliable risk management strategy, such as the kind of volatility-based approach described in this paper, enables institutions to re-risk without needing to have certainty about the market bottom, as it entails significant protection against further drawdowns and yet will participate when the market recovers.

Summary: A Permanent Allocation to Volatility-Based Risk Mitigation is a Strategic Necessity for Institutional Investors

An airbag must be permanently installed in a car in order for it to deploy when it is needed – during the moment of impact, the timing of which cannot be predicted.

Similarly, we believe institutional investors obtain the best results from a stabilization approach based on volatility when they make it a full-time strategic allocation in their portfolios. A permanent strategic allocation to volatility-based stabilization ensures investors and their beneficiaries can benefit from the consistent and sustained mitigation of volatility shocks on an ongoing basis.

Securian Asset Management is an Associate Member of TEXPERS. The views expressed in this article are those of the authors and not necessarily Securian Asset Management nor TEXPERS.

About the Authors

Craig Stapleton, CFA, FRM is Senior Vice President – Head of ALM & Quantitative Strategies at Securian Asset Management. As Vice President and Portfolio Manager, Stapleton is responsible for derivatives, agency MBS, government and municipal bonds, quantitative analytics, cash management, ALM and strategic asset allocation for the Minnesota Life General Account. He is the head of the quantitative analysis and research group. Stapleton is also the co-portfolio manager for the Equity Stabilization strategies and the Securian Asset Management Strategic Dividend Income portfolios. Prior to his role as portfolio manager, Stapleton provided quantitative analysis, security and portfolio risk statistics, and derivatives hedging capabilities for Securian Asset Management and its clients. Stapleton is a CFA Charterholder, and a member of the CFA Institute and CFA Society of Minnesota.


Jeremy Gogos, Ph.D., CFA, is Vice President and Portfolio Manager of Quantitative Strategies at Securian Asset Management. He monitors domestic and international equity volatility and correlation, manages fund equity exposure, and evaluates equity allocation model performance. Gogos provides quantitative analysis, security and portfolio risk statistics, and execution of derivative and hedging initiatives. He has also supported annuity, life insurance, and investment product designs with stochastic and historical simulation and performance evaluation. Prior to joining Securian Asset Management, Gogos was a computer programmer supporting Securian Retirement’s 401(k) recordkeeping and trading platforms. He is a CFA Charterholder, and is a member of the CFA Institute and CFA Society of Minnesota.