Monday, February 24, 2020

Investment Insights

Revisiting emerging market smaller companies


by Osamu Yamagata/Guest Contributor 

We believe that, as an asset class, emerging markets, or EMs, are underappreciated. This is clear when we consider the outsized representation of global client allocation of 5% against a global GDP contribution of 37% as of 2019 year end. This is in light of the fact that about 65% of growth in the world economy has been driven by EMs over the last 10 years.

In this context, emerging market smaller companies present an even smaller contribution — less than 1% of global client assets. To add further context, of the MSCI ACWI Smid Index, EM represents an 11% weighting, but global investor allocation is the lowest across the main regions at 6%.

Why have investors stayed clear of small caps in EMs? A simplistic explanation would be the divergence in the performance of the EM large-cap index over the last five years. The large-cap index experienced a total return of 34% against a return of 17% for the small-cap index.

But put into context, the large-cap index performance has been driven by strong performance of a narrow group of stocks. Just five companies contributed 20% of the total return of the benchmark. Namely, Chinese Internet giants Alibaba, Tencent and associated holding company Naspers, as well as semiconductor leaders Samsung Electronics and TSMC. However, by the cap-limited nature of the smaller-companies index with little concentration risk, return has been broader, with the largest benchmark constituent accounting for less than 1%.

So, while technology stocks have driven returns for larger companies, the smaller companies’ returns come from broader sources. For active managers, they may represent a wider pool of opportunities to build a portfolio. It is also worth noting that the 1,644 stocks in the index are still an under representation, with multiples of small-cap stocks yet to be included. A prime example is the Chinese market, which represents an under-penetrated market representing <10% of the index.

The wider opportunity set and lower quality of information provides a fertile hunting ground for active managers. In the smaller-company space, quality of information is often lower. This is because a quarter of index constituents have either one or zero analysts, which has led to a consistently higher dispersion of returns for smaller companies. This, however, optimizes the potential for active outperformance for those with strong research capabilities. 


Chart 1: Greater dispersion of returns within small caps

Source: Aberdeen Standard Investments, Factset, 31 December 2019/Click image to enlarge chart.
The chart above shows the discrete annual differences between the average top 20 performers and the average bottom 20 performers for each period. Indices: MSCI EM & MSCI EM Small Cap. Indexes are unmanaged and have been provided for comparison purposes only. No fees or expenses are reflected. Individuals cannot invest directly in an index. For illustrative purposes only. 

One other notable aspect of smaller companies is the higher domestic investor base and local ownership. Share prices reflect local economy dynamics as opposed to wider swings of global liquidity. To date, passive funds represent less than 5% of assets in the small-cap space, compared to 33% of assets in the large-cap space.

The outlook for EM is increasingly bright. We believe many economies have passed the inflection point, which means markets less geared toward global growth will contribute more as we see the benefits of lowering inflation, lower rates and recovery of growth. Brazil, for example, is enjoying the benefits of lower rates, firmer fiscal management, recovering growth and concurrent shift in local allocations toward equity. In this context, domestically oriented smaller companies in Brazil have far outperformed their larger-company peers with a total return of 37% against 7% for larger companies over the last year.


Chart 2: Brazilian small caps outperform large-cap peers

Source: Aberdeen Standard Investments, December 31 2019/Click image to enlarge chart.
In the chart above, indexes are unmanaged and have been provided for comparison purposes only. No fees or expenses are reflected. Individuals cannot invest directly in an index. For illustrative purposes only.

In general, equity markets today are trading on higher multiples globally. But in this context, EM small caps are trading on the lowest premium versus historical averages, which further supports the investment case.

Lastly, an overriding misconception has been to see smaller companies as a riskier asset class. Evidence doesn’t support this, however. Passive flows and concentration of super sector returns have led to a divergence in volatility and predicted that beta of small cap compared to the larger companies is 0.75x. Therefore, we see smaller companies as a means to generate better risk-adjusted returns toward emerging markets.


Chart 3: EM small-cap vs. EM large-cap beta

Source: Aberdeen Standard Investments, December 31, 2019. Click image to enlarge chart.
In the chart above, indexes are unmanaged and have been provided for comparison purposes only. No fees or expenses are reflected. Individuals cannot invest directly in an index. For illustrative purposes only.

Our conclusion therefore is that an allocation to small caps is complementary to larger companies, and, for active managers, the wider opportunity set and dispersion of returns provide a stronger platform for active returns in the coming years.

The views expressed herein do not constitute research, investment advice or trade recommendations, do not necessarily represent the views of Aberdeen Standard Investments or TEXPERS, and are subject to revision over time.

About the Author:

Investment Insights

Embracing change: Humans plus machines


Image by Pavlofox from www.pixabay.com.


by Ken McAtamney/Guest Contributor

Technology, for asset managers and their clients, is less about technology stocks and more about the way disruption affects corporate performance. But what are the implications for active equity asset managers and, by extension, their clients as asset allocators?

The role of the active equity manager has been called into question in recent years as undifferentiated performance, and high fees are compounded by allocators’ difficulty in identifying outperforming managers.

But the solutions available to allocators have also changed, thanks to technology. The disaggregation of alpha and beta, cheap passive beta exposure, and the evolution of cheap factor exposures are just a few examples. 


A Perfect Era for Passive—But That Will Change


Passive, smart beta, and factor investing take a rules-based approach to varying degrees, and they have the ability to identify and exploit patterns at low to no cost.

But we have been in a perfect era for this. Volatility has been low since the global financial crisis, thanks to abundant capital. And a concentrated set of leaders has dominated the market as a result of winner-take-all economics aided by network effects.

So, while there is a clear role for these strategies, we must remember that passive is, by definition, unable to predict disruptions in economic outcomes and profit pools, and thus any index, however “smart,” is always lagging. 

Applications for AI


As for AI, we do see some applications—for example, to help exploit near-term market inefficiencies. Specifically, AI may remove investment manager biases, so implementation and execution improves. But for the foreseeable future, this appears to be effective only over the shorter investment horizons.

I also don’t see AI replacing humans. At William Blair, we use machine learning to test and modify the factor models that inform our discretionary process. For now, at least, AI cannot do a better job than humans when it comes to predicting big changes, such as future consumption habits and innovations.

If the next era differs from the past era (due to de-globalization, deconsolidation, and the break-up of big tech, for example), those changes will be better understood by humans than machines. Humans are better at strategy, while machines are better at tactics.

Consider Japan’s $1.34 trillion government pension fund, GPIF, which used AI not to predict manager performance but to monitor fund behavior. In other words, does a particular fund behave and react to the market or economy as predicted? Does the manager really do what it says it will do? That’s tactical, not strategic. 

Profit Pools Shift


As investors in quality growth companies, we are very interested in how technology has changed the nature of competitive advantages, created and destroyed new business models, transformed competition, and changed costs, capabilities, and convenience.

The 20-year history of the retail industry is a good example. In consumer retail, technology has changed how products are created, marketed, and sold. From fast fashion to the customer’s information advantage, the entire equation has changed.

It’s not a surprise that retail industry profits have grown slightly more than the overall market over the past 20 years, by 6.7% versus 6.5% (represented by the Russell 3000 Index narrowed down to the retail industry).

But the shifts within that growth are surprising. Internet sales now comprise 28% of total retail industry profits, up from nothing 20 years ago (a compound annual growth rate of more than 24% since 1999). Meanwhile, general merchandise and department stores have gone from 55% of total retail 20 years ago to 11% today.

IBM Watson can beat humans at the ancient and intricate game of Go, but could a machine have predicted Amazon’s ever-expanding total addressable market (TAM) better than humans could? Doubtful. This is the reality of the nature of the innovation and disruption cycle. It takes creativity, insight, and imagination to identify it. 

Click image to enlarge chart.


A Diversified Approach


What are the takeaways? How can we as asset managers do better? How can our clients do better?

The answer is not to change who we are. One financial behemoth has said it is not an investment bank, but a technology company in the financial services industry. I take issue with that. We don’t have to pretend to be technology companies in order to survive in our industry, or any industry.

We do, however, have to assess our organization’s culture and mindset toward technology. Sometimes in the asset management business, we consider change a dirty word. But evolution is imperative, and a proactive approach to understanding and utilizing technology is better than a reactive one. Success really is about change, and innovation more broadly.

The good news is that many trends—including reduced costs due to digitization, for example—are making things more accessible. But acquiring the capabilities and talent will be challenging, and will take time (not to mention discomfort) to adjust. We are all feeling that already. 

Internal Mindset and Culture Key


My framework for adapting to change is to consider the external solutions available, the internal forces necessary, and approaches that combine these elements.

There are many external solutions that provide businesses with the capabilities of bigger organization without the infrastructure and costs, including cloud computing and partnerships with start-up accelerator programs.

But most important may be business leaders taking responsibility. At William Blair, I chair our technology working group, and two years ago we created the role of technology leader within our business unit.

One of our goals is to create a borderless technology environment, bringing technology from the back office into the front office and blurring the boundaries of technology and investment skills.

And, our proprietary Summit research platform codifies our investment process. Specifically, it enables our portfolio managers and analysts to efficiently collaborate to identify high-conviction investment ideas in the pursuit of better client outcomes.

To reiterate, I also don’t see technology replacing humans. Humans will continue to have a role, which is why we believe so deeply in the role of active management. 

The views expressed herein do not constitute research, investment advice or trade recommendations, do not necessarily represent the views of William Blair or TEXPERS, and are subject to revision over time.

About the Authors:

Investment Insights

Remastering volatility: Reducing noise in equity allocations


By Christopher Hogbin, Christopher Marx and Nelson Yu/Guest Contributors

Volatility is a challenge that has vexed equity investors for decades, yet its root causes are often misunderstood. Understanding how a company’s business profile determines a stock’s risk can help investors prepare for uncertainty and make better decisions when market turbulence strikes.

Erratic market behavior often seems like a mystery. Bad economic news, political chaos, interest-rate moves or an industry crisis can trigger widespread anxiety among investors and inflict indiscriminate damage to equities. This volatility is the admission price that investors must pay to access the higher return potential of stocks and other risk assets. Yet volatility also reduces returns through risk drag, and often prompts emotional, financially destructive decisions that stem from the fear of loss.

Behind the headlines that incite volatility, market fluctuations are ultimately driven by the collective behavior of individual stocks. And the risk profile of a stock often stems from fundamental and researchable aspects of its business model and strategy.

Confidence in Cash Flows—the Source of Risk

For individual stocks, the source of volatility is derived from investor confidence in company cash flows. In finance textbooks, the value of an asset is defined as a function of its future cash flows and the discount rate, which itself is a function of interest rates. It’s also affected by the perceived variability of a company’s cash-flow potential; greater uncertainty around cash flows will raise the discount rate and lower a stock’s valuation. So, anything that can provoke uncertainty around a company’s cash flows may become a source of volatility. A company’s income statement may offer important clues about its resilience or underlying vulnerabilities.

Let’s start at the top, with revenues. Sales are an important driver of company earnings, but can be unpredictable. And sales volumes can be very sensitive to changes in economic cycles in industries like autos and retail; changes in supply/demand balances, which often get reflected in changing prices for commodities, for example; and changes in competition or technology, which can impact market shares. Other industries, such as consumer staples and utilities, typically see more stable demand and pricing, and thus more stable sales. Our research shows that sectors with more stable sales patterns tend to be less volatile (See chart below).

Click image to enlarge chart.

Within any sector, understanding a company’s business model and forecasting its cash flows is the cornerstone of active equity investing. Just as important, fundamental research must also identify the risks to a company’s cash flows. Our research shows that companies with a higher volatility of cash flows also tend to have more volatile stock returns (see left chart, below). This means that the structure of a company’s business model can also be a source of volatility—and its income statement may offer important clues about its resilience or underlying vulnerabilities.


Click image to enlarge charts.

Cost Structures Matter

Cash flows can also be profoundly affected by cost structures. Consider two companies with very different cost structures. One requires little capital to get started, so it has low operating leverage. The other requires a much bigger investment to get started and has high operating leverage. The company with lower operating leverage starts out in a much more profitable position, while the company with higher operating leverage starts off with losses and will need to sell more units to become profitable (see right chart, above).

So how the company makes money can have a material impact on its profitability and consistency. Industries that generally exhibit lower operating leverage include services and retail. Companies with higher operating leverage tend to have high fixed costs, either from large upfront capital requirements in industries like mining and autos, or a fixed labor force. These types of companies also tend to be more sensitive to the economic cycle and to the changing tastes and habits of consumers.

Taking Calculated Risks, Avoiding Unintended Exposures

Of course, business models aren’t the only thing that determines a company’s risk profile. Company debt positions (or leverage) and sensitivity to exogenous shocks from the macroeconomy or politics will also influence the volatility of its stock. In future blogs, we will examine other sources of volatility and how to manage them. But we believe that with a clearer grasp of the way company-specific risks are at the heart of a stock’s volatility, active managers can better assess the risk-taking needed to achieve desired returns and reduce noise that can undermine confidence in an allocation.

By understanding the sources of volatility, portfolio managers can better drive their outcomes through intentional views—taking risk where insight identifies an opportunity for improved returns, while controlling the volatility of unintended exposures. This helps reduce the noise that interferes with an investing plan, and is the key to remastering portfolios and realizing the benefits of long-term equity returns.

This blog post is based on a whitepaper that was published in October 2019 titled Remastering Volatility: Reducing Noise in Equity Allocations.

The views expressed herein do not constitute research, investment advice or trade recommendations, do not necessarily represent the views of Alliance Bernstein or TEXPERS, and are subject to revision over time.

About the Authors:


Investment Insights

The next credit cycle


Graphic by Deedster from www.pixabay.com.

by Bruce Richards and Louis Hanover/Guest Contributors

The corporate credit markets have evolved over the past decade in a way that has created pitfalls that will likely materialize when the credit cycle turns negative or a recession occurs. We expect that the corporate credit markets will behave differently during the next credit cycle than they have during previous cycles. 

In our recent thought-piece, we present key themes of today’s corporate credit markets for investors to consider when preparing for the next downturn. While the evolution of corporate credit markets since the last recession has introduced plenty of downside risks to various credit investments, it will also lead to a tremendous opportunity to deploy capital and realize outsized returns for patient investors who are truly opportunistic.

The U.S. economy is enjoying its longest expansion in the post-war era. As concerns regarding slowing growth accumulated, the Federal Reserve eased rates three times in 2019. Corporate earnings have softened in recent quarters, despite a healthy U.S. consumer and job growth. A reduction in consumer leverage has been driven by strong employment, wage gains and improving balance sheets given the stability in housing prices. 

In fact, despite the U.S. economy growing by approximately 47% since the last recession (from $14.6 to $21.5 trillion), total household debt has grown by only 10% (from $12.7 to $14.0 trillion) and housing related debt has shrunk by 2% (from $10.0 to $9.8 trillion). Conversely, BBB-rated and high yield companies carry record levels of leverage. Consequently, we believe the effects of an economic and credit downturn will be much different from those felt during the last cycle, with a greater impact on these debt-laden companies, while the U.S. consumer will likely perform relatively well.

We do not forecast the timing or magnitude of the next recession. Our focus is to outline the dynamics that have changed since the last recession and will impact the corporate credit markets in the next economic downturn. We highlight the following key themes: 
  • Liquidity will be the greatest risk
  • Rating agencies, behind the curve
  • Covenant protections have disappeared
  • Default rates expected to peak at a lower level compared to prior cycles
  • Recovery rates are expected to be lower
  • Leverage ratios are considerably higher
  • Senior bank loans have absorbed junior debt
  • Pro-forma adjustments and add-backs are misleading
  • The use of unrestricted subsidiaries for asset transfers
  • Middle market direct lending has surged
  • Corporate credit issuance has soared
  • BBBs: unprecedented growth
  • Credit has become extremely bifurcated
In our recent whitepaper, we discuss many key themes and important differences that investors should focus on as we enter the next phase of the corporate credit cycle. 

Significantly weaker liquidity, massive growth of the high yield market and the confluence of structural changes that have occurred since the 2008 crisis lead us to believe that there will be a record amount of fallen angels and corporate distress across a diverse set of industries in the coming credit cycle. As a result, investors should prepare for when the corporate credit cycle turns. Historically, distressed cycles have occurred infrequently. You only get one bite of this apple once a decade, so don’t miss it, be prepared, timing is everything.

The views expressed herein do not constitute research, investment advice or trade recommendations, do not necessarily represent the views of Marathon Asset Management or TEXPERS, and are subject to revision over time.

About the Authors:


A Case for ESG Investing in Texas Public Plans

ESG Investing has Seen a Rapid Growth in Assets Over the Last Few Years

Tuesday, February 18, 2020

Pension Review Board Adds New Reporting Rules to Texas Administrative Code


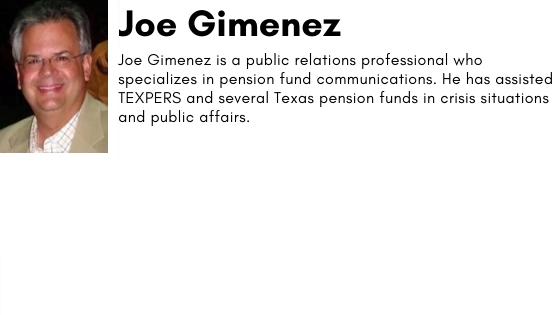
Joe Gimenez/Photo
Christopher Zook, second from left, listens during a Feb. 6 meeting of the Texas Pension Review Board.

By Joe Gimenez/Guest Contributor

During its Feb. 6 meeting, the Texas Pension Review Board followed through on legislative bills passed last year by adding rules to the Texas Administrative Code for the reporting of investment fees. The Board also adopted staff proposals for categorizing asset classes and a template for investment expense reporting.


Investment Fees


On June 10, Gov. Greg Abbott signed Senate Bill 322, mandating public pension funds to provide a “comprehensive analysis of the retirement system’s investment process that covers all asset classes,” according to the text of the law. The bill requires pension funds to begin reporting, by May 1, how much they spend seeking returns through bonds, stocks, hedge funds, real estate, private equity, and cash. The law and the rules for such disclosures do not require pension funds to provide the name of the investment managers who manage the asset class.


Click chart to enlarge.

However, newly appointed PRB board member Christopher Zook suggested that a fee reporting template encourages such detail in the interest of full transparency. Zook is the founder, chairman, and chief investment officer of CAZ Investments, a firm that invests its personal capital with those of its clients on a performance basis. The Board also appointed Zook to chair a new Investments committee, which will convene sometime before the next full Board meeting in June.

Read our guide to the new rules in a past edition of TEXPERS' Pension Observer membership magazine.


Training


The Board also approved a rule decreasing by half the reporting requirements for trustee and administrator training. Before the rule change, systems reported twice a year on the four hours of training their trustees and administrators obtained over a two-year cycle. PRB staff believe that yearly reporting will suffice to meet the statutory requirements of its Minimum Education Training, which the Board established in 2013. From now on, public retirement systems will need to inform the PRB of training its trustees and staff have received by Sept. 1.


TEXPERS is offering training May 2, the day before its annual conference, May 3-6, on Galveston Island. Click to register for Basic or Advanced trustee training.


Actuarial Health


Also, during the meeting, agency staff reported on key statistics of actuarial health for the 99 systems which the agency monitors. Staff actuary Kenny Herbold noted that 30 pension funds updated their stats from an Oct. 17 report, thereby providing a better sense of overall pension system health. The number of pension systems not meeting the PRB’s recommended amortization period of 30 years or less declined by one system, from 37 to 36. But the number of systems in an infinite amortization condition increased by five to 13, indicating that the 2018 market declines are now being factored into the PRB’s actuarial report. According to the actuarial report, only three of Texas’ 99 systems now target a return of 8 percent or higher. This is a multi-year low.

Target Rates


PRB actuarial staff also presented a new chart showing the distribution of target rates among categories of plans. Board members Keith Brainard and Marcia Dush seized on the fact that most plans organized under the Texas Local Firefighters’ Relief and Retirement Act still target higher rates of return than other types of systems.

The 42 TLFFRA funds average a 7.52 percent rate, while the Texas average is 7.29 percent and the national average is 7.27 percent. They noted how the high rates might not be in the systems’ best interest, considering that payroll growth assumptions and expectations for city contributions have not been met in recent years. The Board also noted how the district and supplemental plans’ target rates average 6.96 percent, significantly below the Texas and national averages.

The Texas Pension Review Board is mandated to oversee all state and local government public retirement systems in Texas regarding their actuarial soundness. The next meeting of the Pension Review Board will be on Jun. 30. Meetings of the investment and actuarial committees are likely to be held in March and April, according to agency sources.

About the Author: 

Friday, February 14, 2020

When it comes to retirement, 

public employees are looking for security


It’s St. Valentine’s Day and the Texas Association of Public Employee Retirement Systems asked a few of the nonprofit’s board members to share their love of defined-benefit retirement plans.

Based on their comments, their earnings represent their commitment as police officers and firefighters to their communities. Their retirement benefits are hard-earned after putting in years of often dangerous work and contributing their own funds to their programs. The benefits allow them to have a safety net of income for spouses when Social Security may not provide enough or anything at all when they die.

If your unfamiliar with defined-benefit pensions let’s give you a brief description. Essentially, it is a retirement safety net that firefighters, police officers, educators, and millions of other state and local government workers in Texas earn in exchange for their job dedication – and honestly, often low wages. Providing retirement benefits help state and local governments compete with the private sector in the recruitment and retention of public employees.

Studies have shown that 401(k)s and other defined-contribution plans are not as successful in ensuring public employees have a secure retirement. Those investing into 401(k)s or similarly constructed defined-contribution pension plans on their own also are not investing enough and do not know how to invest their hard-earned money properly. Plus, Social Security either won’t provide enough retirement income or, in many cases, none because some public employees do not qualify for the federal benefit.

Also consider that millions of Texans have not saved enough for retirement. Without enough income, older adults will not be able to afford the resources that enable them to live independently, pay for medical and other health care expenses, and continue to contribute to society. Defined-benefit pension plans provide a consistent and predictable stream of revenue to public employees – the men and women who have dedicated their careers to the public sector (to you).

A defined-benefit plan delivers retirement income with little effort on the part of public employees while providing retirement security. And unlike private-sector workers, public employees share in the cost of their retirement benefits. A public employee’s contributions typically make up a set percentage of their salaries.


How critical is the need to offer public servants a secure retirement? Retirement benefits is an essential job feature, even more so than salary, according to a newnational poll by the nonprofit, nonpartisan National Institute on Retirement Security.

In a published report on its findings, nearly all state and local workers (93 percent) indicated in the survey that pensions incentivize public workers to stay with their jobs. Even more agree that a pension is a useful tool for attracting and retaining employees. NIRS published the results of their polling in a report, State and Local Employees Views on Their Jobs, Pay and Benefits, in November. 

Here is what else the NIRS poll found:


  • Cutting benefits could have severe workforce consequences. Seventy-three percent of respondents indicated they would be more likely to leave their jobs if their pensions were cut. 
  • Nearly 92 percent of all state and local employees believe that abolishing secure-retirement plans for public employees would weaken a government’s ability to attract and retain qualified workers. A majority also indicates that doing away with pensions would undermine public safety and the U.S. education system. 
  • Among Millennials, those who reached young adulthood in the early 21st century and are collectively known as “dissatisfied job hoppers,” 84 percent working in state and local government indicate they are satisfied with their current jobs. Nearly 74 percent claim that a pension benefit is a significant reason they decided to work in the public sector, and 85 percent said they plan to stick with their current employer until they are eligible for retirement or can no longer work. 


That’s enough statistics. Let’s hear from some of TEXPERS’ own board members, who have or still work in public-sector jobs:

"I love my pension because it represents the years I worked as a firefighter for the City of Big Spring, Texas. The City of Big Spring Fire Department first initiated the pension plan back in the late 1930s and early '40s. Through the many years of change, the trustees have made steady improvements to the plan with the help of city leaders. The retirement plan provides security for my family and me."
- Paul Brown, TEXPERS Board President 
Big Spring Firemen's Relief & Retirement Fund 


Here are a few job-specific fact sheets provided by NIRS:


Firefighters (double click images to expand)


Police (double click images to expand)


Teachers (double click images to expand)
 

State Employees (double click images to expand)
 

The Texas Association of Public Employee Retirement Systems is a statewide nonprofit educational association organized in 1989. Our members are trustees, administrators, professional service providers, employee groups and associations engaged or interested in the management of public employee retirement systems. TEXPERS member systems and employee group members represent 2.3 million active and retired public employees with assets totaling nearly $89 billion. To learn more, visit www.texpers.orgwww.texpers.org.