

Expanding Awareness of Public Pension Issues
Showing posts with label equity. Show all posts
Showing posts with label equity. Show all posts
Wednesday, October 28, 2020


Tuesday, August 25, 2020
The Case for a Permanent Allocation to an Equity Stabilization Strategy
 |
| Image by Samuel F. Johanns from Pixabay |
By CRAIG STAPLETON & JEREMY GOGOS/Securian Asset Management
Key Points
- Institutional investors face a balancing act between two equally important needs: achieving robust long-term returns while avoiding the painful consequences of near-term drawdowns.
- Traditional asset allocation, risk parity and other hedging strategies have failed to perform as expected during recent downturns. Fixed income assets have moved closely in line with equities in times of crisis.
- Equity volatility levels exhibit a persistent and reliable relationship with equity returns over time and through market cycles, including the latest market crisis, as illustrated for large cap U.S. equities in Chart 1.
- A permanent strategic allocation to an equity stabilization strategy that utilizes the persistent volatility/return relationship can improve investors’ long-term risk/return ratios – even if implemented right after a market selloff. A rules-based approach, using the reliable indicator of recent volatility, can be successfully applied at any time via a spectrum of implementations against single or multiple risk asset class portfolios.
Chart 1: There is a Clear Relationship Between Monthly Equity Returns and Recent Volatility
Average Monthly S&P 500 Returns for Ranges of Realized Monthly Volatility(January 1, 1928 – March 31, 2020)
 |
Click chart to enlarge. Source: Bloomberg. Data as of April 1, 2020. The data spans from January 1, 1928, to March 31, 2020, and the table displays the average monthly returns for the S&P 500® for the time periods shown where the average monthly volatility was in the different volatility categories shown. Volatility is measured as the annualized standard deviation of daily returns of the index. The S&P 500® Index is an unmanaged index of 500 stocks that is generally representative of the performance of larger companies in the U.S and investments cannot be made directly in the indices. See additional disclosures at the end of the materials for additional information. |
Risk Assets: Investors Manage a Double-Edged Sword
Institutional investors face the pernicious dilemma of having mutually conflicting needs. When building a portfolio, investors start with the understanding that, over the long term, expected return and volatility are strongly positively correlated. Unfortunately, most investors need both significant levels of return to meet their long-term goals and a stable stream of returns to ensure financial viability. A defined benefit pension plan, for example, needs solid returns to meet its actuarial funding goals and pay pensions, while it needs stability to avoid erosion of its funded status.
For institutional investors seeking stable funding, the same risk assets that provide essential upside potential also represent significant exposure to downside risk and unstable results. Although investors’ need for risk mitigation is high, most investors have not implemented such strategies to date, for reasons we discuss below.
The Risks of Managing Risk: Why Most Portfolios Remain Exposed
For a risk mitigation strategy to be reliable, it must be built on a market relationship that is persistent over time. Unfortunately, most risk mitigation strategies to-date have been based on historic correlations that have broken down during strong bear markets, when they are most needed.
Fixed Income is an Anchor to Windward Until a
Hurricane Comes
Unfortunately, the correlation between fixed income and equity investments is not stable through time. As Chart 2 illustrates, there have been long periods where equities and bonds were positively correlated, and thus traditional portfolio diversification did not reduce portfolio risk.
Chart 2: Fixed Income is Not a Reliable Equity Hedge
3-Month Rolling Correlation – S&P 500 and Bloomberg Barclays U.S. Aggregate Bond Index(January 1, 1989 - March 31, 2020)
 |
| Source: Bloomberg Barclays US Aggregate Bond Index and Securian Asset Management, Inc. Data as of April 1, 2020. The data spans from January 1, 1989, to March 31, 2020, and displays analysis of two indices, the 3-month rolling correlation of the S&P 500 vs. the Bloomberg Barclays U.S. Aggregate Bond Index. The blue circles highlight the specific periods of time. Click chart to enlarge. |
In crises — when an offset to downside equity risk is most needed — equities and fixed income often sell off at the same time. During the COVID-19 crisis, the correlation between fixed income assets and equities quickly became much less negative, diluting fixed income’s portfolio diversification benefit. Further, there have been extended periods of time where fixed income was positively correlated with equity. Both are highlighted in the circles in Chart 2.
Volatility is a Reliable Indicator of Equity Performance
A persistent and reliable relationship exists between 1-month volatility and 1‑month equity returns, both positive and negative. Volatility episodes tend to demonstrate persistence. As Chart 3 clearly shows, since 1928, for the S&P 500, high 1-month volatility tends to be associated with poor 1-month returns; and vice versa.
Chart 3: Since 1928, Volatility Levels Have Reliably Signaled Equity Returns
Average Monthly S&P 500 Return vs. Average Monthly Realized Volatility
(January 1, 1928 - March 31, 2020)
 |
Source: Bloomberg, Securian Asset Management, Inc. Data as of April 1, 2020. Data spans from January 1, 1928, to March 31, 2020, and displays the average monthly S&P 500 return vs. the average monthly realized volatility. Click chart to enlarge. |
While we use the S&P 500 for the illustration above, our research shows the same relationship between volatility and returns across other equity markets.
Volatility-Based Equity Stabilization Strategy Can Improve the Risk/Return Ratio
A strategy based on the reliably strong relationship between equity volatility and returns is well-suited to deliver portfolio risk mitigation in a more consistent manner than traditional asset allocation. An Equity Stabilization Strategy systematically adjusts equity exposures based on the volatility/return relationship. This approach holds greater equity market exposure during lower volatility periods, which tends to lead to better performance, as illustrated in Chart 3. Conversely, we believe this approach can quickly reduce equity market exposure during the higher volatility periods that tend to produce unfavorable performance, mitigating the drawdown of assets.
The Case for a Permanent Strategic Portfolio Allocation to Volatility-Based Equity Stabilization Strategies
To-date, institutional investors have implemented volatility-based stabilization strategies sporadically or not at all. We believe this reticence is due to two key investor concerns: Portfolio risk hedging is complex, and a desire to avoid periodic carrying costs of hedging – particularly right after a major market selloff.
A permanent strategic allocation to a systematic volatility-based approach over a full market cycle addresses both of these issues.
A simple set of rules using 1-month risk asset volatility as the principal metric is the foundation of an equity stabilization strategy. A strategic overlay primarily employing listed equity index futures ensures transparency and simplicity while avoiding counterparty risk.
Implementing Volatility-Based Risk Mitigation is Straightforward
The Stabilized Equity Portfolio Hypothetical Example, is based on a pension plan aiming to reduce its domestic U.S. equity annualized volatility by about 25% from its historic average level of around 18% per annum. In this hypothetical, the pension fund added a futures-based overlay on top of its equity portfolio, using listed S&P 500 futures to dial the effective equity exposure up or down based on volatility. Using this overlay, the portfolio manager allows the portfolio’s effective equity position to drop down to 20% of the portfolio’s net assets in high volatility environments and increase it to as much as 150% in low volatility environments.
Chart 4: Equity Stabilization Strategy Improves Risk/Return
Stabilized Equity Portfolio Hypothetical Risk & Return
(January 1, 1988 - March 31, 2020)
 |
| Source: Bloomberg, Securian Asset Management, Inc. The data spans from January 1, 1988, to March 31, 2020, and displays the hypothetical backtested returns of a hypothetical portfolio created for illustrative purposes only. No investor actually achieved the results shown. No representation is being made that any account will or is likely to achieve results similar to those shown. Please see important disclosures on the limitations of hypothetical backtested performance at the end of the materials. Click chart to enlarge. |
Skillful Implementation Adds Further Value to a Stabilization Strategy
The pension fund’s overlay manager should take the following steps:
- Run the overlay model daily
- Combine experience-based judgement and additional subsidiary indicators such as the VIX and high-yield spreads to better assess the likely volatility environment daily
- Primarily use listed futures, and use listed options when inexpensive or more attractive
- Employ strict trading rules to protect the pension fund from being whipsawed in rapidly changing market environments
- Employ strong derivatives governance and oversight
Balanced Portfolios Benefit as Well
Using a volatility-based risk mitigation strategy on the equity portion of a balanced portfolio is an effective way to adjust the equity/bond mix to changing risk environments, without the costs and timing issues of selling the underlying assets.
Positive Full Market Cycle Cost/Benefit
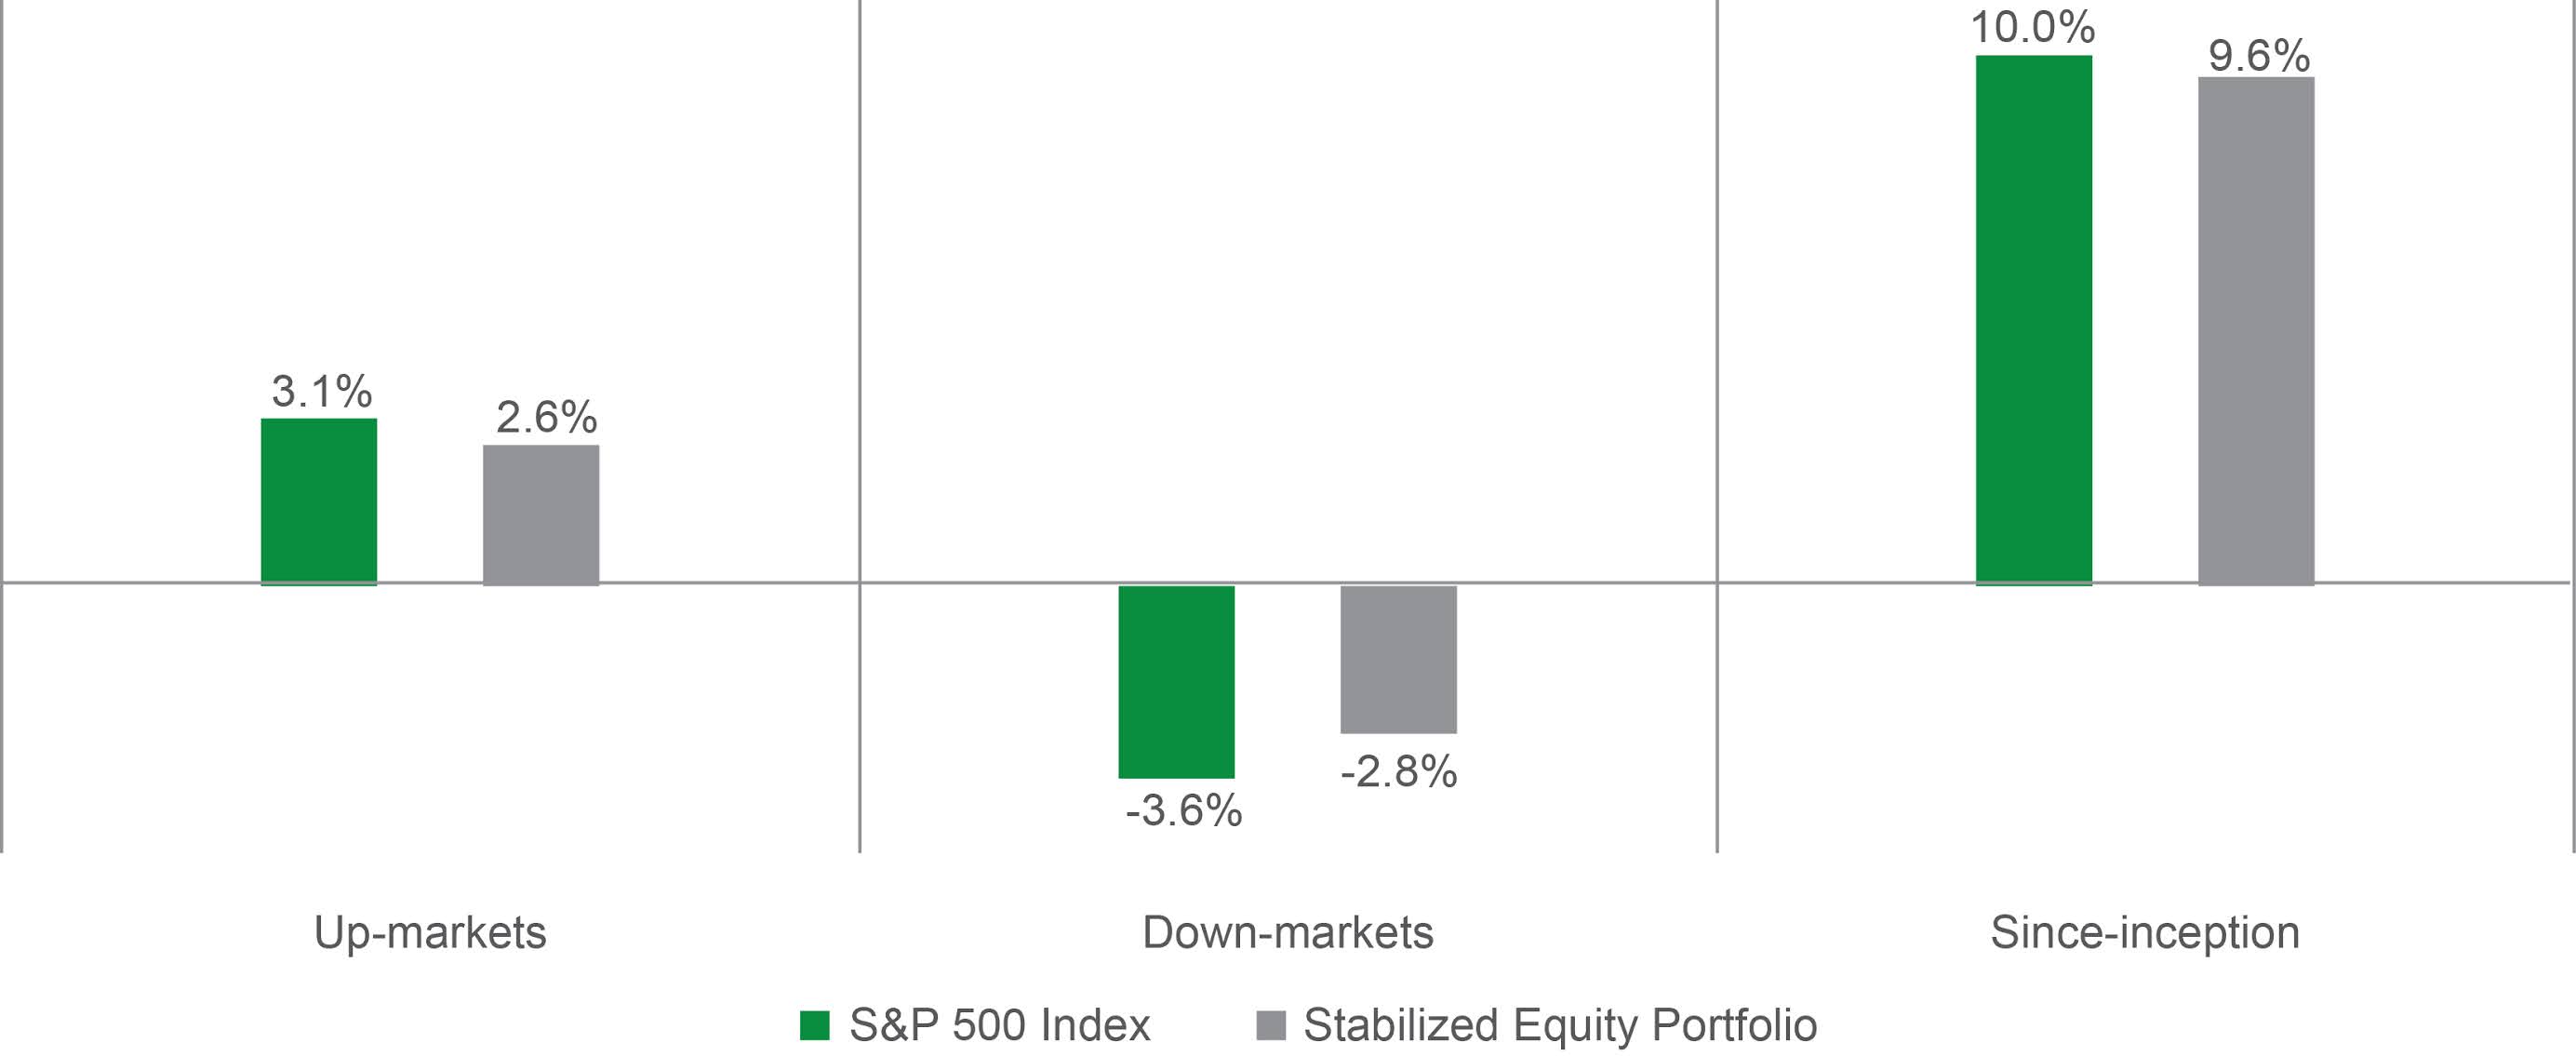
When a volatility-based portfolio risk management approach is maintained throughout a full market cycle, its outperformance in down markets can offset its underperformance in up markets, rendering a market-like return over a full cycle.
Chart 5: Thoughtful Equity Stabilization Can Pay for Itself Over a Full Market Cycle
Average Monthly Returns of the S&P 500 Index and the Stabilized Equity Portfolio Hypothetical Example in Up Markets, Down Markets, and Longer-term
(January 1, 1988 - March 31, 2020)
 |
| Source: Bloomberg, Securian Asset Management, Inc. The data spans from January 1, 1988, to March 31, 2020, and displays the hypothetical backtested returns of a hypothetical portfolio created for illustrative purposes only. No investor actually achieved the results shown. No representation is being made that any account will or is likely to achieve results similar to those shown. Please see important disclosures on the limitations of hypothetical backtested performance at the end of the materials. Click chart to enlarge. |
Implementing a volatility-based risk mitigation approach by means of a derivative overlay means there is no disposition of underlying assets, merely a modification of risk exposures, thus avoiding trading costs and buy/sell spread costs. While there may be periodic ‘carrying costs’ of foregone performance in a bull market, the strategy tends to pay for itself over a full market cycle – avoiding the extensive long-term portfolio damage that a liquidity crisis during a bear market can wreak – as shown in Chart 5, above.
Portfolio Hedging is Vital after a Market Selloff
Perhaps counterintuitively, a volatility-based stabilization strategy is vital after a severe market shock, such as the recent COVID-19 pandemic shock.
After an historic downturn in the markets, most institutional portfolios are significantly underweight equities. In order to benefit fully when the markets inevitably recover – and in order to rebalance to their strategic asset mix targets – institutions need to re-risk by adding to their equity exposures.
This may be a difficult decision for many institutions, because the market bottom is only known to have occurred well after the fact. A reliable risk management strategy, such as the kind of volatility-based approach described in this paper, enables institutions to re-risk without needing to have certainty about the market bottom, as it entails significant protection against further drawdowns and yet will participate when the market recovers.
Summary: A Permanent Allocation to Volatility-Based Risk Mitigation is a Strategic Necessity for Institutional Investors
An airbag must be permanently installed in a car in order for it to deploy when it is needed – during the moment of impact, the timing of which cannot be predicted.
Similarly, we believe institutional investors obtain the best results from a stabilization approach based on volatility when they make it a full-time strategic allocation in their portfolios. A permanent strategic allocation to volatility-based stabilization ensures investors and their beneficiaries can benefit from the consistent and sustained mitigation of volatility shocks on an ongoing basis.
Securian Asset Management is an Associate Member of TEXPERS. The views expressed in this article are those of the authors and not necessarily Securian Asset Management nor TEXPERS.
About the Authors
Craig Stapleton, CFA, FRM is Senior Vice President – Head of ALM & Quantitative Strategies at Securian Asset Management. As Vice President and Portfolio Manager, Stapleton is responsible for derivatives, agency MBS, government and municipal bonds, quantitative analytics, cash management, ALM and strategic asset allocation for the Minnesota Life General Account. He is the head of the quantitative analysis and research group. Stapleton is also the co-portfolio manager for the Equity Stabilization strategies and the Securian Asset Management Strategic Dividend Income portfolios. Prior to his role as portfolio manager, Stapleton provided quantitative analysis, security and portfolio risk statistics, and derivatives hedging capabilities for Securian Asset Management and its clients. Stapleton is a CFA Charterholder, and a member of the CFA Institute and CFA Society of Minnesota.
Jeremy Gogos, Ph.D., CFA, is Vice President and Portfolio Manager of Quantitative Strategies at Securian Asset Management. He monitors domestic and international equity volatility and correlation, manages fund equity exposure, and evaluates equity allocation model performance. Gogos provides quantitative analysis, security and portfolio risk statistics, and execution of derivative and hedging initiatives. He has also supported annuity, life insurance, and investment product designs with stochastic and historical simulation and performance evaluation. Prior to joining Securian Asset Management, Gogos was a computer programmer supporting Securian Retirement’s 401(k) recordkeeping and trading platforms. He is a CFA Charterholder, and is a member of the CFA Institute and CFA Society of Minnesota.
Monday, August 24, 2020
Has COVID-19 Made Sustainable Investing More – or Less – Important?
 |
| Photo courtesy of Macquarie Group LTD. |
By BARRY GLADSTEIN/Macquarie Investment Management
Environmental, social, and governance (ESG) investing has drawn considerable investor attention in recent years. Morningstar[1] reported that 2019 represented a record year of flows into ESG-related funds in both Europe and the United States. Along with this increased interest, Macquarie Investment Management has continued its commitment to sustainability such as through new ESG analytical and performance measurement tools for investment teams to integrate into their process. Yet, as the world continues to seek effective ways to deal with the COVID-19 pandemic, investors have questioned if there has been a shift in the relative importance of ESG issues when assessing investments. In other words, has ESG lost some of its relevance during the pandemic – or does the crisis make it even more important.
There are currently two schools of thoughts on this subject. One is that with the considerable toll that the pandemic has taken from both a societal and economic standpoint, seemingly more distant and lower priority issues such as climate change will take a back seat, especially as financial assets needed to make changes appear more scarce.
The other thought is that people have been ignoring warnings about a global pandemic for quite some time and the resulting lack of preparedness is a critical problem the world now faces. The same logic can be applied to longer-tail issues such as climate risk, where a potential crisis may similarly be lessened with nearer-term action.
An eye to the long term
Macquarie Investment Management’s view on the relative importance of ESG in the investment process has not changed as the result of the pandemic. As Lotte Beck, ESG manager for Macquarie’s Luxembourg-based ValueInvest team, put it, “Our approach to ESG has always been to look at it as a stamp of quality. Stable, quality companies usually also have a higher level of ESG management and vice versa.”
The majority of our investment teams employ a fundamental approach toward identifying and assessing securities. Inherent to their investment process is an in-depth analysis of economic, competitive, and other factors that may influence future revenues and earnings of the issuer of the securities, including factors that have been identified as material from an ESG perspective.
Parsing out “E,” “S,” and “G”
This emphasis on materiality may result in a shift in focus regarding ESG factor consideration when evaluating potential investments. In the past few years, the “E” in ESG – environmental – has taken on ever increasing importance as investors have assessed the risks of climate change and its potential effect on a company’s future revenue and expenses. An example of this is the impact of global warming on the future crop supply for food processors and other industries that rely on these vital raw materials. In a 2019 report, the US Department of Agriculture’s Economic Research Service found that if greenhouse gasses are allowed to continue to increase, US production of corn and soybeans could decline as much as 80% over the next 60 years.
Of a more immediate nature are the dramatic increase in wildfires in recent years that many attribute to climate change. Barry Klein, utilities analyst on Macquarie’s Global Listed Infrastructure team, has regularly traveled to California to gain insights into the impact of utility-caused wildfires, assess the response of utilities, and meet with legislators, regulators, and management teams. “It’s important, from both an investment and an environmental responsibility perspective, that we gain a full understanding of the response of the different parties, and how seriously they are taking this growing issue,” Klein said.While environmental factors remain important risks to consider, “S”, or social factors, are also taking on increasing importance as investors assess the risks of COVID-19 on individual companies. Workplace health and safety is a social factor that the Sustainability Accounting Standards Board (SASB) has identified as being important to many industries. Adrian David, senior credit analyst on Macquarie’s Fixed Income Global Credit Research team, pointed out that workplace safety has historically been a big focus for riskier industries such as mining or energy, Now, challenged by the rapid spread of the virus, more companies outside these sectors are considering how they can operate while providing a safe environment for their staff.
The “G”, or governance aspect of ESG, has always been an important area of focus for investors and will continue to be in the current environment. Steven Catricks, senior portfolio manager on Macquarie’s US Small Mid Cap Value Equity team, noted “how companies address governance issues such as executive compensation will be an important determinant of management quality. Share buyback and dividend policy will also take on greater relevance as stakeholders assess managements’ ability to be effective stewards of capital.”
ESG only a subset of fundamental analysis
Macquarie Investment Management is an Associate Member of TEXPERS.The views expressed in this article are those of the author and not necessarily Macquarie Investment Management nor TEXPERS.
Sources
[1] Morningstar, Jan. 10, 2020, “Sustainable Fund Flows in 2019 Smash Previous Records.”
[2] Morningstar, May 14, 2020, “There’s Ample Room for Sustainable Investing to Grow in the U.S.”
About the Author
Barry Gladstein, CFA, leads Macquarie Investment Management’s Environmental, Social, and Governance (ESG) efforts.
The Mega-Cap Conundrum
 |
| Image by Arek Socha from Pixabay |
By EDWARD J. RAKHAM, PH.D./Los Angeles Capital
2019 was an unusually challenging year for quantitative equity strategies with a large proportion of quantitative strategies underperforming their stated benchmark on a rolling one year basis. There has, therefore, been a great deal of interest in understanding the shortcomings of quantitative portfolios over the same calendar year.
The struggles faced by quants in 2019 were related not just to the efficacy of quantitative signals but also to the ability of systematic strategies to access these signals over that 12-month period – an issue exacerbated by the outperformance of large cap stocks over smaller names over the course of the year.
To further understand the difficulties faced by quants in 2019 it is informative to consider the returns to common quantitative strategies over recent years. The compounded active performance of five simulated portfolios from the end of 2003 to the end of 2019 is given in Figure 1. The portfolios have been constructed using the assets within the developed world opportunity set to have a fixed ex-ante tracking error of 1% relative to a standard world index and, subject to constraints on risk exposures as well as the requirement to be long only and fully invested, maximized exposure to one of the following investment signals: value, momentum, quality, residual reversal and earnings revision. The signals shown represent common quantitative investment factors and the portfolios can be thought of as investable applications that maintain exposure to the listed investment factors at all times.
The struggles faced by quants in 2019 were related not just to the efficacy of quantitative signals but also to the ability of systematic strategies to access these signals over that 12-month period – an issue exacerbated by the outperformance of large cap stocks over smaller names over the course of the year.
To further understand the difficulties faced by quants in 2019 it is informative to consider the returns to common quantitative strategies over recent years. The compounded active performance of five simulated portfolios from the end of 2003 to the end of 2019 is given in Figure 1. The portfolios have been constructed using the assets within the developed world opportunity set to have a fixed ex-ante tracking error of 1% relative to a standard world index and, subject to constraints on risk exposures as well as the requirement to be long only and fully invested, maximized exposure to one of the following investment signals: value, momentum, quality, residual reversal and earnings revision. The signals shown represent common quantitative investment factors and the portfolios can be thought of as investable applications that maintain exposure to the listed investment factors at all times.
Figure 1
 |
| Click chart to enlarge. |
What is immediately clear from Figure 1 is that a quantitative manager implementing one or multiple of these factor portfolios would have added value over the last 15 years. What is also clear, however, is that 2019 saw a downturn in all but one of five of the common quant strategies shown in the figure. Such consistent under performance across almost all of the strategies is unusual. Moreover, at first glance, the results of Figure 1 are somewhat unintuitive. Certainly there were many high quality companies with durable cash flows that performed well in 2019. Residual reversal and earnings revisions factors consistently have proven powerful signals in many different market environments and many of the “winners” in 2019 continued to win throughout the year suggesting that momentum based strategies should also have fared well. Indeed, only the value portfolio’s underperformance in 2019 is in line with expectation as it continues the trend of negative returns to such strategies that have been observed over the last five years.
To further understand the challenges faced by quants and to rationalize investment intuition with Figure 1, it is helpful to consider the performance of the largest names versus the smallest names within the developed world opportunity set over 2019.
Overall, the compounded payoff to the size factor – the return associated with characteristic of being large capitalization – is negative over the last 15 years, consistent with the idea that there is a premium to holding small cap names over larger sized stocks. Performance from the end of 2017 to the end of 2019, however, has been reversed with the largest names in the world developed index outperforming their smaller cap counterparts over the last two years.
Interestingly, the preference for large capitalization names over mid or small capitalization names was even more pronounced in 2019 conditional on those stocks also being, for example, of high momentum or high quality. That is, high quality stocks did well in 2019 if those stocks were also mega caps; high momentum stocks added value if those stocks were also amongst the largest names in the index. Indeed, this was the case for almost all of the factors in Figure 1 throughout last year.
The observation that signal efficacy is concentrated in the largest names for most of the systematic investment signals is of particular relevance to the question of quant performance.
Being overweight the largest names within the global benchmark requires managers to build portfolios with concentrated positions in a handful of large cap names. Many quantitative investment processes tend to result in long only diversified portfolios that hold large numbers of names so as to exploit breadth. Quant portfolios are, as a result, frequently underweight the largest names in the index irrespective of investment style.
Given that quant portfolios tend to access the smaller end of the capitalization spectrum, the performance of the investable quant portfolios of Figure 1 can now be understood. The stark underperformance of investment strategies constructed around these signals was as much related to the portfolio’s ability to access the mega caps within the opportunity set as it was to the performance of the signals themselves. That is, for a given quantitative investment signal in 2019, it was almost always necessary to buy exposure to these factors amongst the largest names in the opportunity set while simultaneously avoiding the smaller end of the market cap spectrum – an allocation that simply does not come naturally to most quantitative portfolios.
Given the market environment of 2019, and the consistent performance of the largest names within the opportunity set, it is tempting to conclude that quant managers should adjust their investment processes to account for continued mega cap performance. While lessons must be learned from the events of 2019 there is also risk in assuming that market environments and factor behavior continues indefinitely. Investor preferences for particular factors and assets tends to be cyclical and while large cap growth assets may continue to perform well in the near future, a change in economic fortunes could result in a change in their outlook.
In the short term, however, challenges to performance may continue to plague quant investment processes if factor efficacy remains focused within the largest end of the market. Nevertheless such an environment does not, on an ongoing basis, preclude the existence of alternative investment ideas within the broad opportunity set that are unrelated to size. Systematic managers who can find such ideas and, importantly, express those ideas efficiently within an investment portfolio may still be able to overcome the headwinds of mega cap outperformance.
Los Angeles Capital is an Associate Member of TEXPERS.The views expressed in this article are those of the author and not necessarily Los Angeles Capital nor TEXPERS.
About the Author
Ed Rackham, Ph.D., is Co-director of Research at Los Angeles Capital and is responsible for overseeing all functions of the Research department which includes: model development, risk management and factor research. Alongside these broad responsibilities, Rackham specializes in the development of Investment Risk Management tools and he and the Risk Management group focus on the research and development of portfolio construction techniques that are designed to forecast and control the investment risk of the firm’s portfolios. In addition, Rackham and the Risk Management group look at ways to embed the firm’s stock selection views into investment portfolios in a cost-controlled fashion while simultaneously controlling for forecast uncertainty in both portfolio’s expected performance and the portfolio’s forward-looking risk. Prior to joining Los Angeles Capital, he spent six years at Wilshire Associates researching and developing risk and portfolio analytics tools, most recently as the Head of Research and Development of their Equity Analytics group. Previously, Rackham was an instructor in mathematics and physical chemistry at the University of Oxford, where he also earned his doctorate.
Friday, August 21, 2020
Capturing the Ups and Downs in Coronavirus Equity Markets
 |
| Image by ChristianChan from iStock. |
By KENT HARGIS, SAMMY SUZUKI & JILLIAN GELIEBTER/Alliance Bernstein
Several equity factors diverged significantly from their
typical performance patterns during the COVID-19 crisis. By understanding how
factor returns behaved in this market correction relative to their historic
norms, investors can not only prepare for future volatility but also take
advantage of short-term market dislocations.
Challenges to Safety Stocks
Factors, groups of stocks that target specific drivers of
return across an index or market, had startling performance results during the
coronavirus market disruption. Minimum Volatility (Min Vol) stocks outperformed
the MSCI World Index in the sell-off though their downside protection was not
as strong as usual, and their upside capture was lower than expected in the
subsequent market rally. Value stocks fell further than expected and then
failed to outperform during the rebound—as they typically do.
WHAT IT MEANS: The MSCI World Index is a broad global equity index that represents large and mid-cap equity performance across all 23 developed markets countries.
But Growth stocks delivered the most surprising results. This was the only factor to protect much better than expected during the downturn, and then also outperform in the bounce off the bottom.
Investors can evaluate these patterns by looking at upside/downside capture. Upside capture measures how much the factor increased relative to a rising broad market. Downside capture measures how much the factor declines relative to the falling market.
By combining these measures—upside capture minus downside capture—we can evaluate total market capture as a spread. A positive spread means the factor collects more good times than bad times, which may lead to outperformance over time. Likewise, a negative spread means the factor accumulates more bad times than good, a result that often leads to underperformance.
Comparing the spread between the upside/downside capture ratio this year to historic norms shows just how different recent performance patterns have been.
For both Min Vol and Value, the upside/downside capture spread was roughly 30% worse than average. For Min Vol stocks, the performance during the downturn was particularly surprising, as these stocks usually provide protection in a falling market. In contrast, Growth stocks posted a positive spread of 29% over average.
 |
| Click chart to enlarge. |
Unusual Circumstances Create Unusual Opportunities
COVID-19 shutdowns created an unconventional cause for
the correction and may have played a hand in the unlikely sector performance
results.
This time around, investors didn’t flock to the traditional relative safety of low-volatility sectors like utilities and real estate during the sell-off. Instead, they congregated in growth companies like online retail, at-home media and technology hardware and equipment—industries that benefited from the health crisis and lockdowns. The performance of the industries, both favored and slighted, contributed to the uncharacteristic upside/downside captures for the factors shown above.
No Norm Here, New or Not
Will these patterns be the new norm? Too hard to say. But
the distortions may provide opportunities for investors to rebalance
portfolios. Since 2013, Min Vol stocks have not been this cheap, and Growth has
not been more expensive.
However, not all Growth stocks are created or valued equally. There are a wide variety of growth businesses with wildly differing valuations, so selectivity is key. And quality defensive investments currently offer some of the best risk-adjusted return potential, in our view.
The world remains an uncertain place. COVID-19 cases continue to increase, US-China tensions are high, economic ambiguity persists, not to mention the upcoming US election. Over the long term, we believe a dynamic defensive strategy can help fuel an offense during volatile market episodes.
The types of stocks that provide protection in a crisis are always changing. By finding select high-quality defensive stocks for a given crisis at reasonable prices, investors can reduce losses in a sell-off, which makes it easier to recover when markets rebound.
Alliance Bernstein is an Associate Member of TEXPERS.The views expressed herein do not constitute research, investment advice or trade recommendations and do not necessarily represent the views of all AB portfolio-management teams or TEXPERS and are subject to revision over time. MSCI makes no express or implied warranties or representations and shall have no liability whatsoever with respect to any MSCI data contained herein.
About the Authors:
Kent Hargis, Co-chief Investment Officer, Strategi Core Equities
Kent
Hargis was promoted to Co-Chief Investment Officer of Strategic Core Equities at AB in 2018. He has been managing the Global, International and US portfolios since
their inception in September 2011, and the Emerging Markets Strategic Core
portfolio since January 2015. Hargis was named Head of Quantitative Research
for Equities in 2009, with responsibility for overseeing the research and
application of risk and return models across the firm’s equity portfolios. He
joined the firm in October 2003 as a senior quantitative strategist.
Sammy Suzuki, CFA, Co-chief Investment Officer, Strategi Core Equities
Sammy
Suzuki was promoted to Co-Chief Investment Officer of Strategic Core Equities
in 2018. He has been managing the Emerging Markets Strategic Core portfolio
since its inception in July 2012, and the global, international and US
portfolios since 2015. Suzuki has managed portfolios for well over a decade.
From 2010 to 2012, he also held the role of director of Fundamental Value
Research, where he managed 50 fundamental analysts globally. Prior to managing
portfolios, Suzuki spent a decade as a research analyst. He joined AB in 1994
as a research associate covering the capital equipment industry, and then became
an analyst covering the technology industry.
Jillian Geliebter, CAIA, Director, Equities
Jillian
Geliebter is a Director of AB’s Equities business. In this role, she works with
the firm’s research and portfolio-management teams, as well as with clients
around the world. Previously, Geliebter was a senior RFP writer for AB’s Equities
services. She has been with the firm since 2009.
Friday, February 23, 2018

Assessing the Merits of
long-only equity allocations
By Marlena Lee, guest columnist
Investors continue to search for effective ways to structure their long-only equity allocations.
Many passive approaches have offered diversified exposure at low management fees with a minimal governance burden. However, concerns about the potential for a sustained period of lower returns have prompted some investors to revisit their decision to index and contemplate adding factors to their portfolios. Assessing the merits (and limitations) of any “factor-based” approach requires asking some seemingly fundamental but important questions:
- Why should there be differences in expected returns across stocks? The chance that all stocks have the exact same expected return is virtually zero. There is a multitude of reasons why different stocks should have different expected returns, such as differences in risk or differences in investor preferences.
- How can you identify these differences in expected returns? A good rule is that investors should not rely solely on back-tested results. There is a saying in statistics – if you torture the data long enough, it will confess to anything. A sound theoretical and empirical framework reduces the chance that a coincidental pattern in historical stock data will affect our conclusions.Valuation theory suggests the price of a stock depends on a few variables. One is what the company owns minus what it owes (book value). Another is what investors expect to receive from holding the stock (expected profits) and the discount rate they apply to those expectations (the investor’s expected return). This framework provides very useful insights. One insight is that the expected return investors demand for holding a stock drives its price. Another is that combining price with book value and expected profits allows us to identify differences in expected returns across stocks. For a given level of expected future profits, the lower the price, the higher the discount rate. For a given price, the higher the expected future profits, the higher the discount rate. Empirical analysis is also important – it can help inform expectations about the magnitude of premiums and build confidence that the premiums we see in the historical data are not there by chance. There are numerous studies documenting size, value, and profitability premiums using many different empirical techniques on large data sets—90 years of US data, 40 years of non-US developed markets data, and 30 years of emerging markets data. If we can expect premiums and have a good way of identifying them, we still need to assess how best to capture them.
- How confident are you that premiums can be captured? What are the risks? If the premiums can be pursued in a well-diversified strategy, this improves the likelihood they can be captured by investors. Why? If results are driven by a small group of stocks or a small percentage of market cap, it is more likely to be a chance result. Additionally, less diversified strategies pursuing premiums are likely to have higher turnover and higher costs.
Our experience is that using current market prices is important in identifying and capturing premiums. Combining current prices with company fundamentals creates an instantaneous snapshot of differences in expected returns. At that specific instance in time, stocks with lower relative prices and/or higher profitability have higher expected returns. If there is a spread in relative prices at any point in time, we should expect a value premium. This implies we can use current prices to continually focus on higher expected returns.
This does not mean that higher expected returns will be realized continuously, or even consistently. For example, it is not unprecedented to see value stocks trail growth stocks over a 10-year period. A period of underperformance like this, however, is not by itself compelling evidence that one should no longer expect a value premium in the future. While there is a non-zero probability that any realized premium can be negative over any given investment horizon, that probability decreases over longer investment horizons.
While we encourage a long-term focus, we acknowledge that doesn’t make any underperformance over the short term less disappointing. Asset owners must be willing to accept that uncertainty as part of investing in premiums, just as they do investing in equities. Asset managers can help by not adding to that uncertainty through chasing chance results or inefficiently targeting premiums.
We believe a strong partnership with clearly set expectations, a long-term focus and expertise in implementation can translate to better outcomes for intermediaries and, ultimately, plan participants.
Dimensional Fund Advisors LP, an investment advisor registered with the Securities and Exchange Commission, receives fees for investment management services provided to client members of TEXPERS. There is no guarantee of strategy success. This information should not be construed as investment advice.
 |
| Marlena Lee |
Marlena Lee is co-head of research and vice president at Dimensional Fund Advisors in Austin. As co-head of research, Lee helps manage the firm's general research efforts. She shapes the research agenda by working with clients and the Sales and Investment teams to identify research topics on a variety of investment-related matters that may be useful to clients, including asset pricing, asset allocation, and retirement. Lee is also a member of the Investment Research Committee. Prior to joining Dimensional, she worked as a teaching assistant for Nobel laureate Eugene Fama, a professor at the University of Chicago Booth School of Business. Lee earned her doctorate in finance and a master's degree from the Chicago Booth School of Business. She also holds a Master of Science in agricultural and resource economics and a Bachelor of Science in managerial economics from the University of California, Davis.
Subscribe to:
Posts (Atom)